
H1 2025 dividend portfolio review: positive returns suggest my income strategy remains on track
My dividend portfolio produced solid income growth and some decent share price gains in Q2. I am cautiously optimistic that after a difficult period, the outlook may be improving.


The second quarter of 2025 proved to be a strong period for UK small and mid-cap stocks. This helped to produce a favourable result for my model dividend portfolio, which has a median market cap of just under £900m.
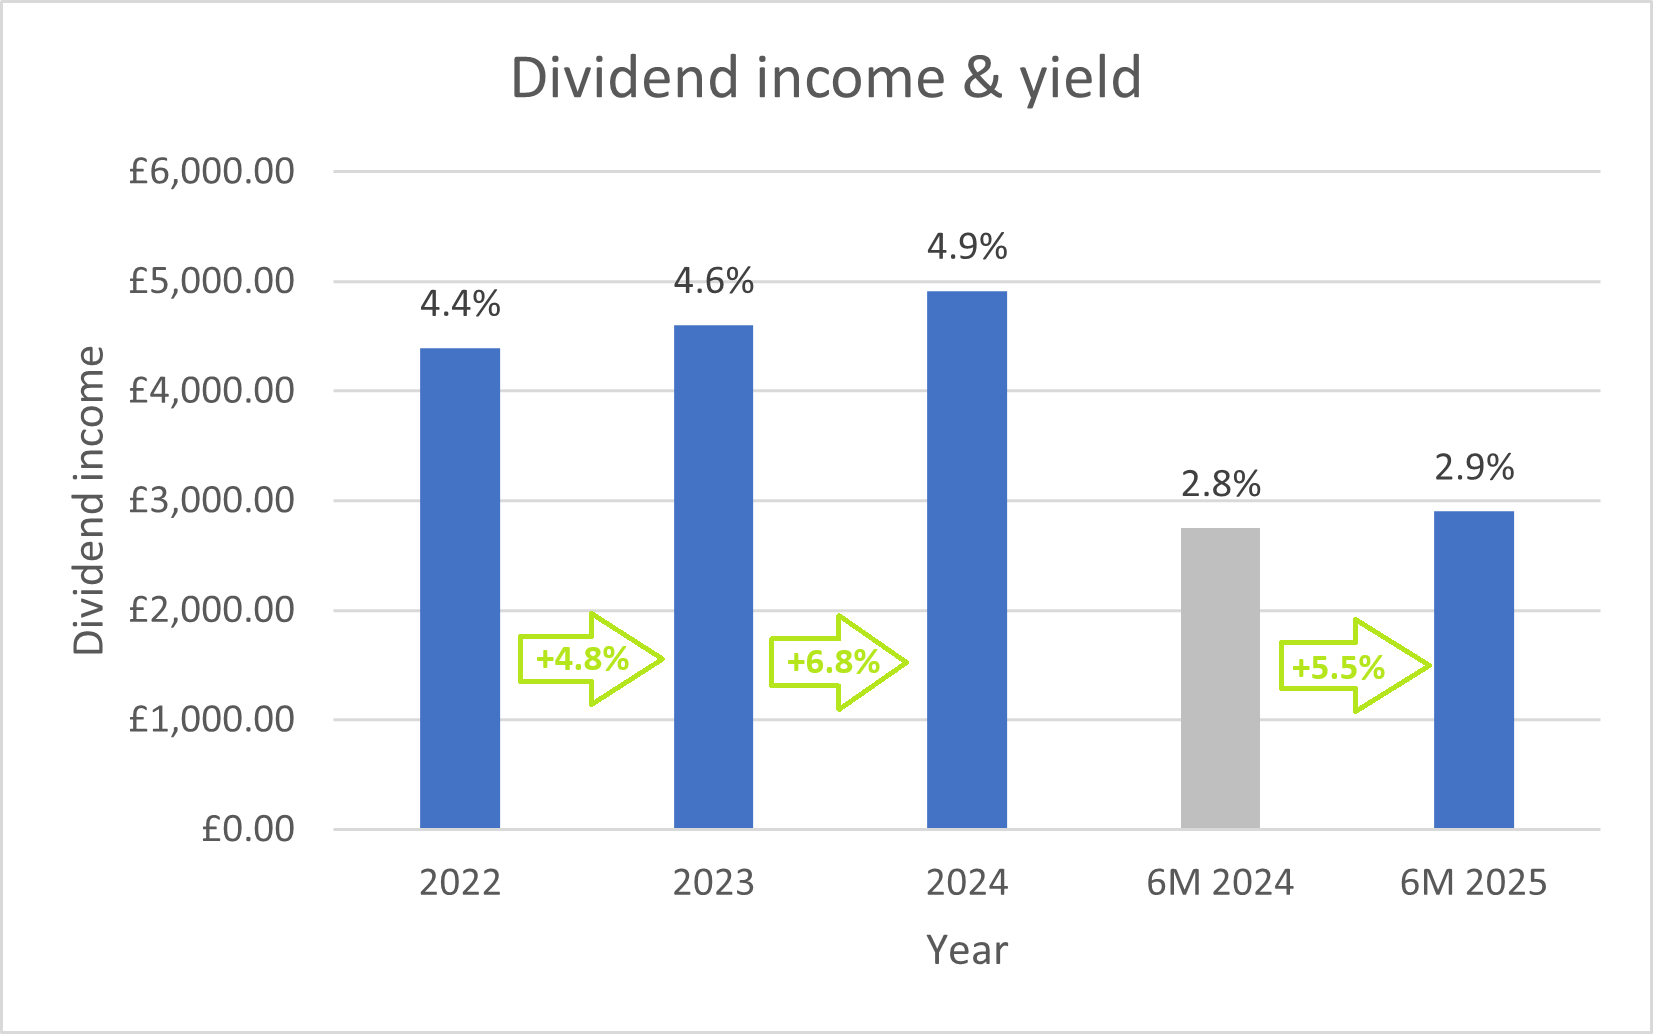
Income from my companies also remained reliable. My primary goal for this portfolio is for it to provide a dividend yield greater than the FTSE 100 and inflation-beating income growth. So far this year, the portfolio has achieved these targets.
Dividends for the first half of this year were 5.5% higher than during the first half of 2024.
The portfolio's rolling 12-month yield of 5.3% is comfortably above the FTSE 100 average of c.3.5%.
After generating income of 2.9% in the first six months of the year, I'm hopeful the portfolio is on track to generate a yield of more than 5% on its initial capital this year:
In the remainder of this review I'll take a closer look at the portfolio's performance during Q2, highlight any trades (there was only one, a top slice) and update my record of the portfolio's key financial metrics.
- Q2/H1 25 portfolio performance review
- Portfolio changes in Q2 25
- Position weightings
- Key financial metrics for the portfolio
- Final thoughts
Q2 25 performance review
Shares within my portfolio delivered the usual broad range of price movements during the second quarter. Happily there was a strong positive bias in Q2, providing a pleasant contrast to Q1:
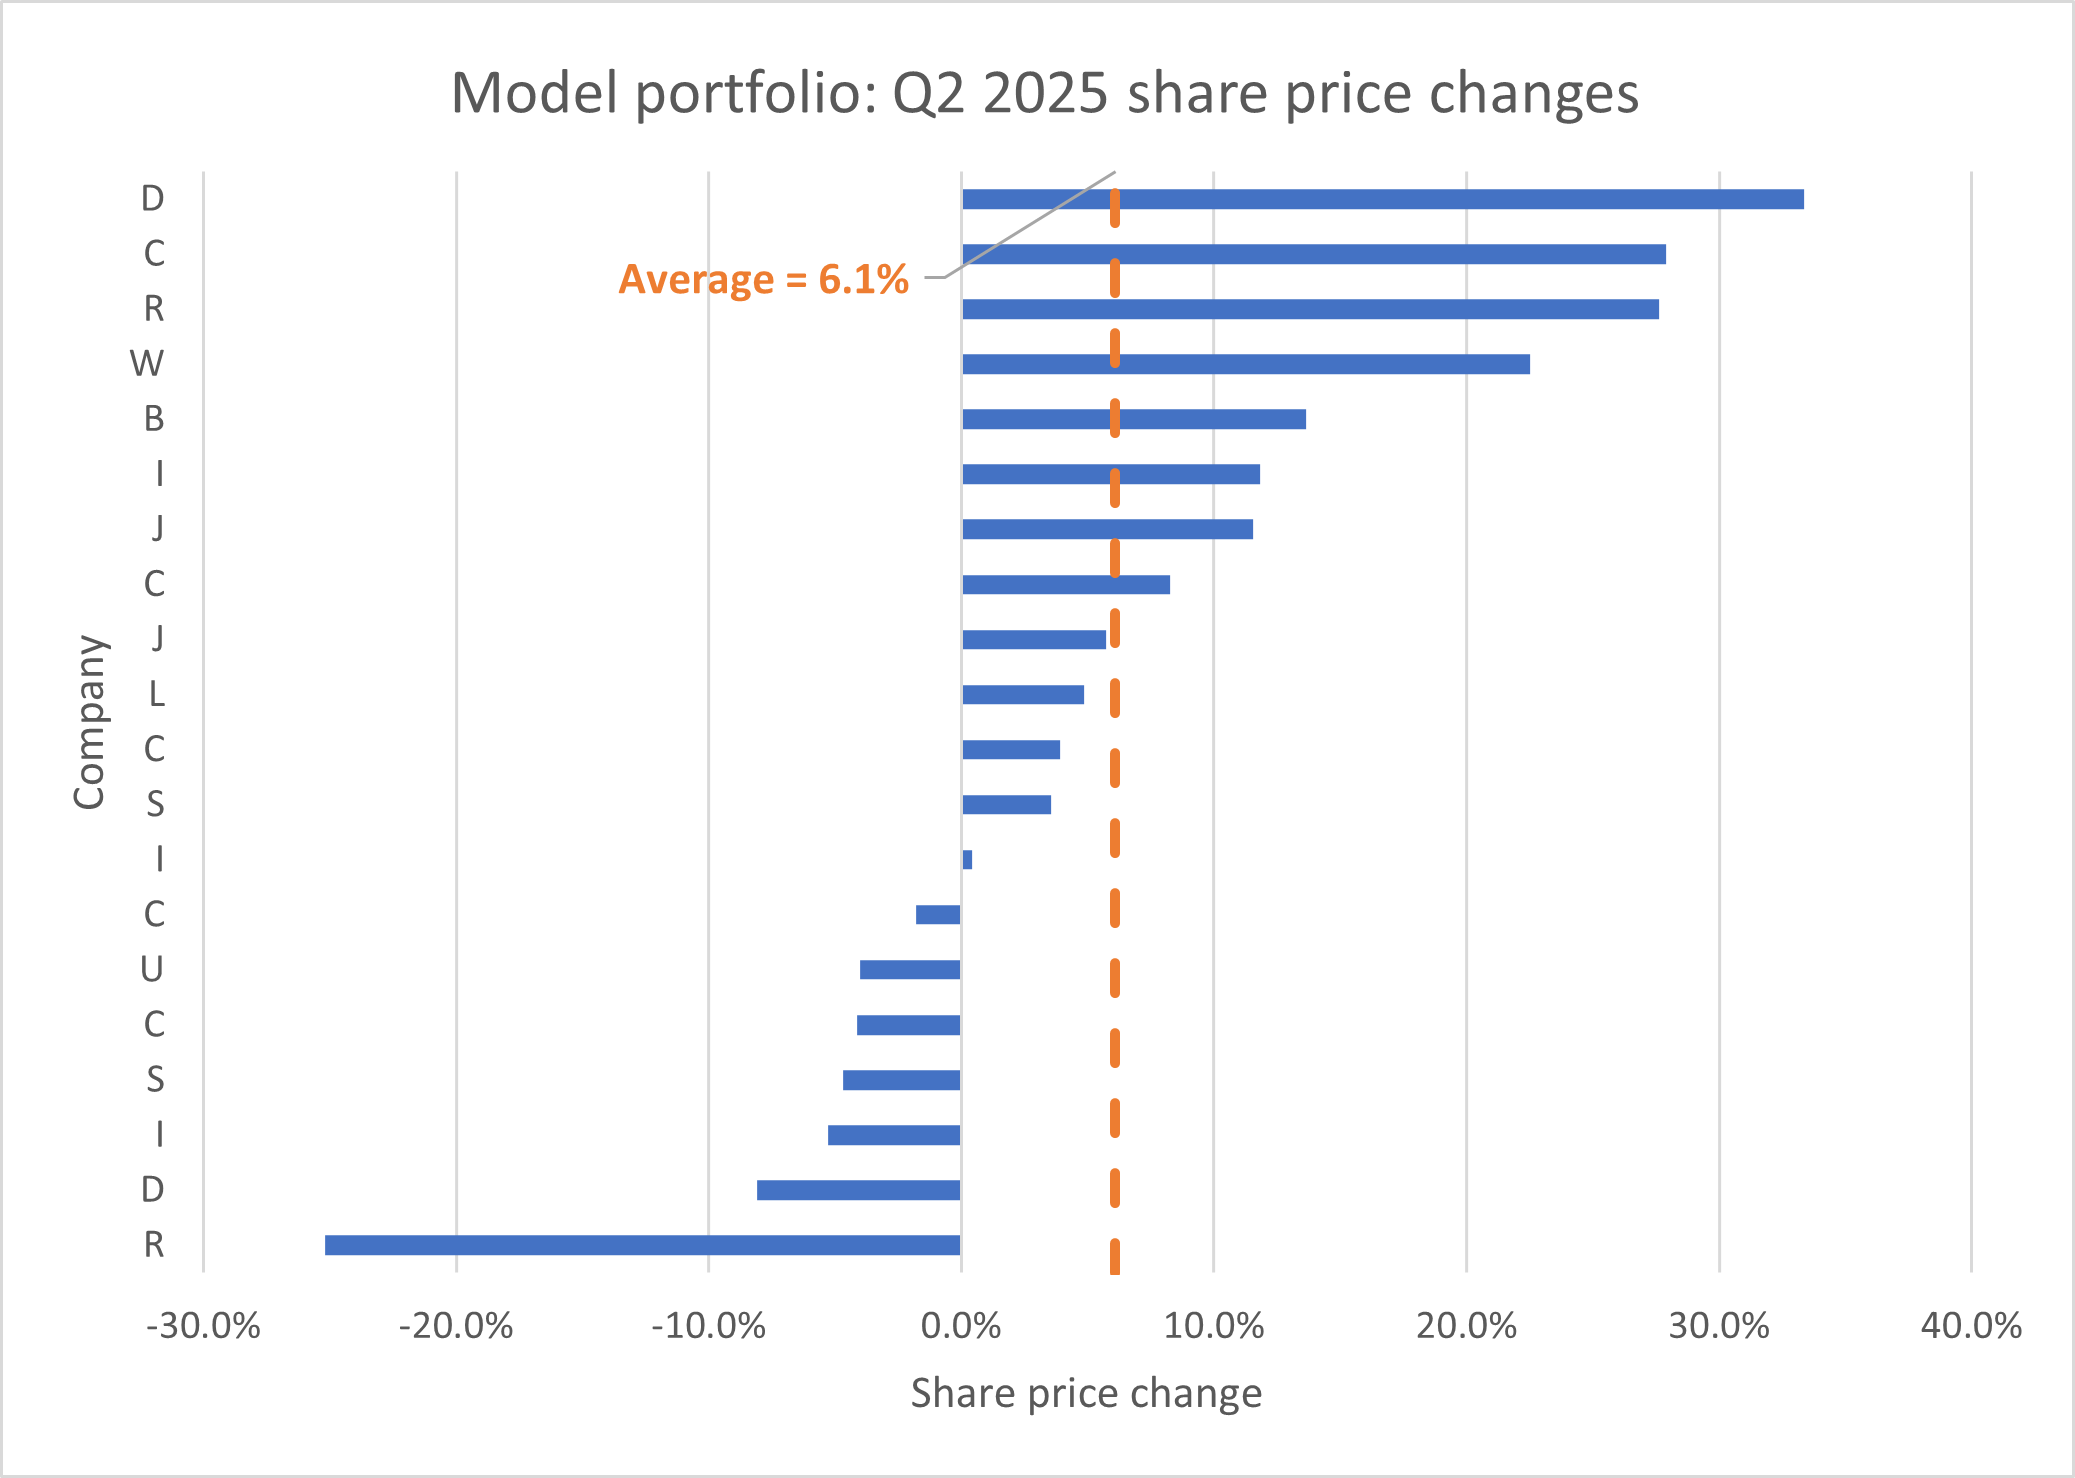
My portfolio's performance reflects the V-shaped recovery in UK markets following April's 'tariff tantrum'. But the portfolio ended the half year in positive territory and outpaced the FTSE 100 during the second quarter, reclaiming some of the underperformance from Q1:
Q2 2025 performance:
- RH model portfolio total return: 8.0%
- FTSE 100 Total Return index: 2.9%
H1 2025 performance:
- RH model portfolio total return: 2.3%
- FTSE 100 Total Return index: 9.8%
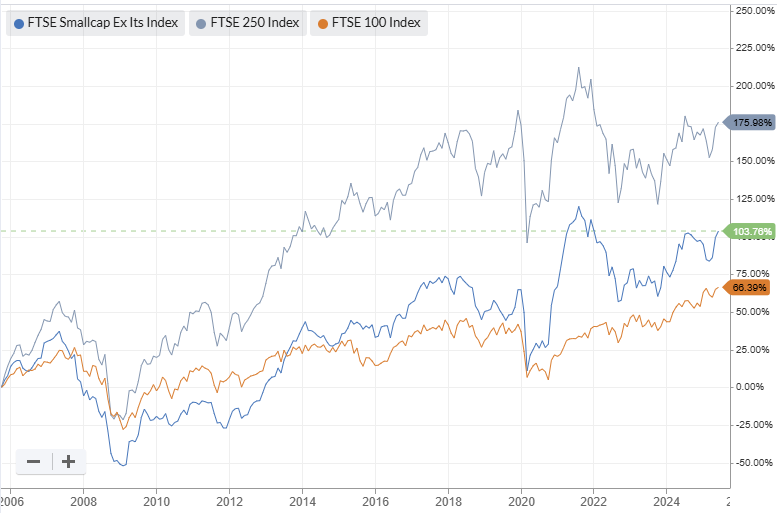
Here's a broader view on the model portfolio's performance since its inception in December 2021:
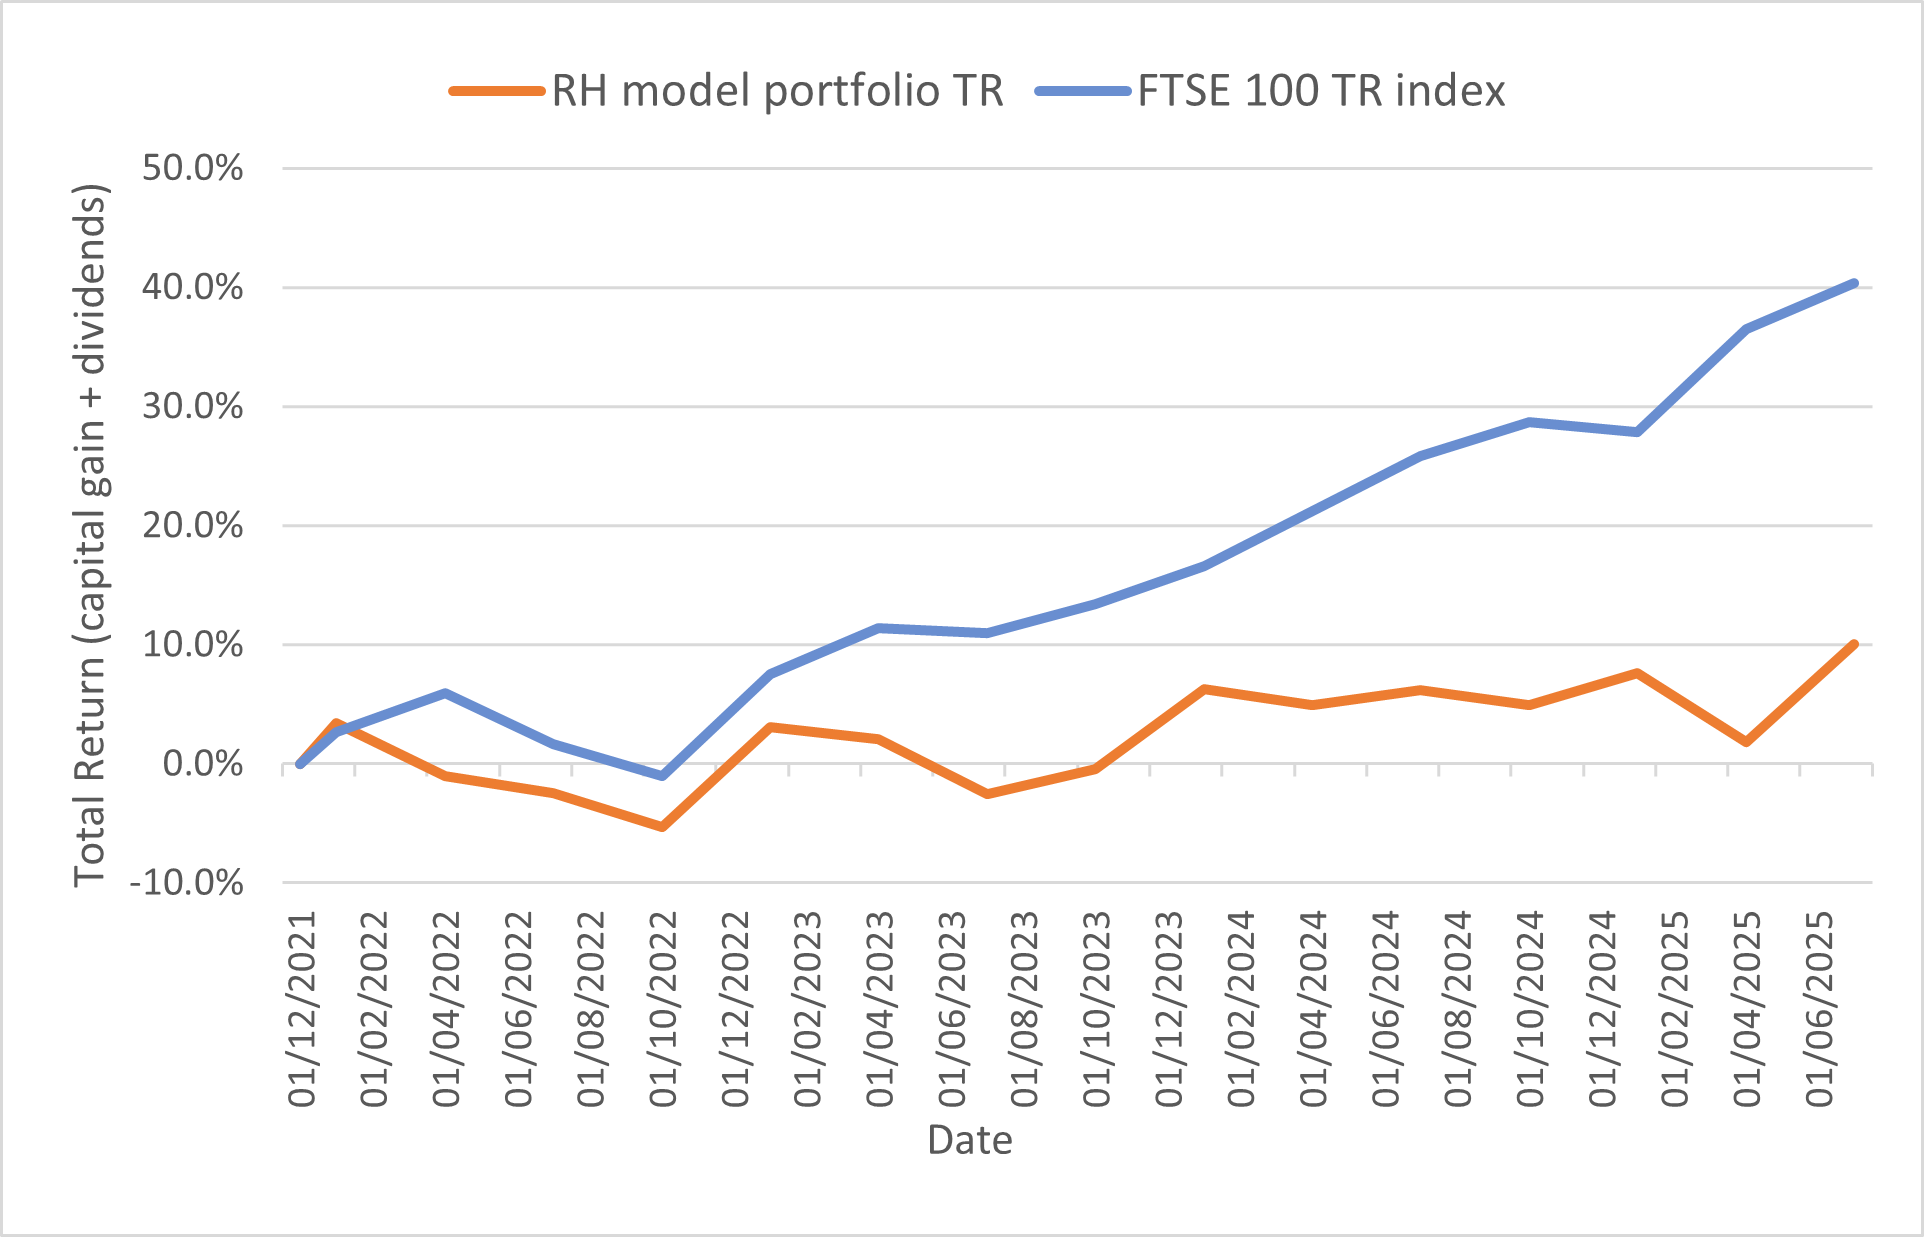
The portfolio's mid-cap bias has left it lagging a resurgent FTSE 100 over the last couple of years. But for what it's worth, my selections (average market cap c.£900m) have outperformed the FTSE 250 since inception:
I'm hopeful the momentum we've started to see in UK small and mid-caps will help to narrow the gap with the FTSE 100. I'll talk more about this shortly.
But of course, it's always possible that I've just not picked the right stocks!
Portfolio changes in Q2 24
I didn't add or remove any companies from the portfolio during the second quarter. I didn't make any top ups, either.
However, I did decide to top slice the portfolio's largest position, 'I'. Shares in this high yielder have risen by 85% since the portfolio's inception, leaving this position weighting at more than 8%.
Including dividends, the total return from this position has been over 115%. It continues to provide an attractive income, but my conviction is weakening on both fundamental and valuation grounds. I discussed this company in more detail in my June update to subscribers.
For all of these reasons, I decided to top-slice this position, which I did on 7 July.
Position weightings
My model portfolio positions are all initiated with a weighting equivalent to about 4.7% of the original portfolio capital.
Occasionally I make top ups or (more rarely) partial sales, as discussed above.
Here's how the model portfolio looked at the end of the quarter. Paid subscribers can see this chart with company names on my portfolio page:
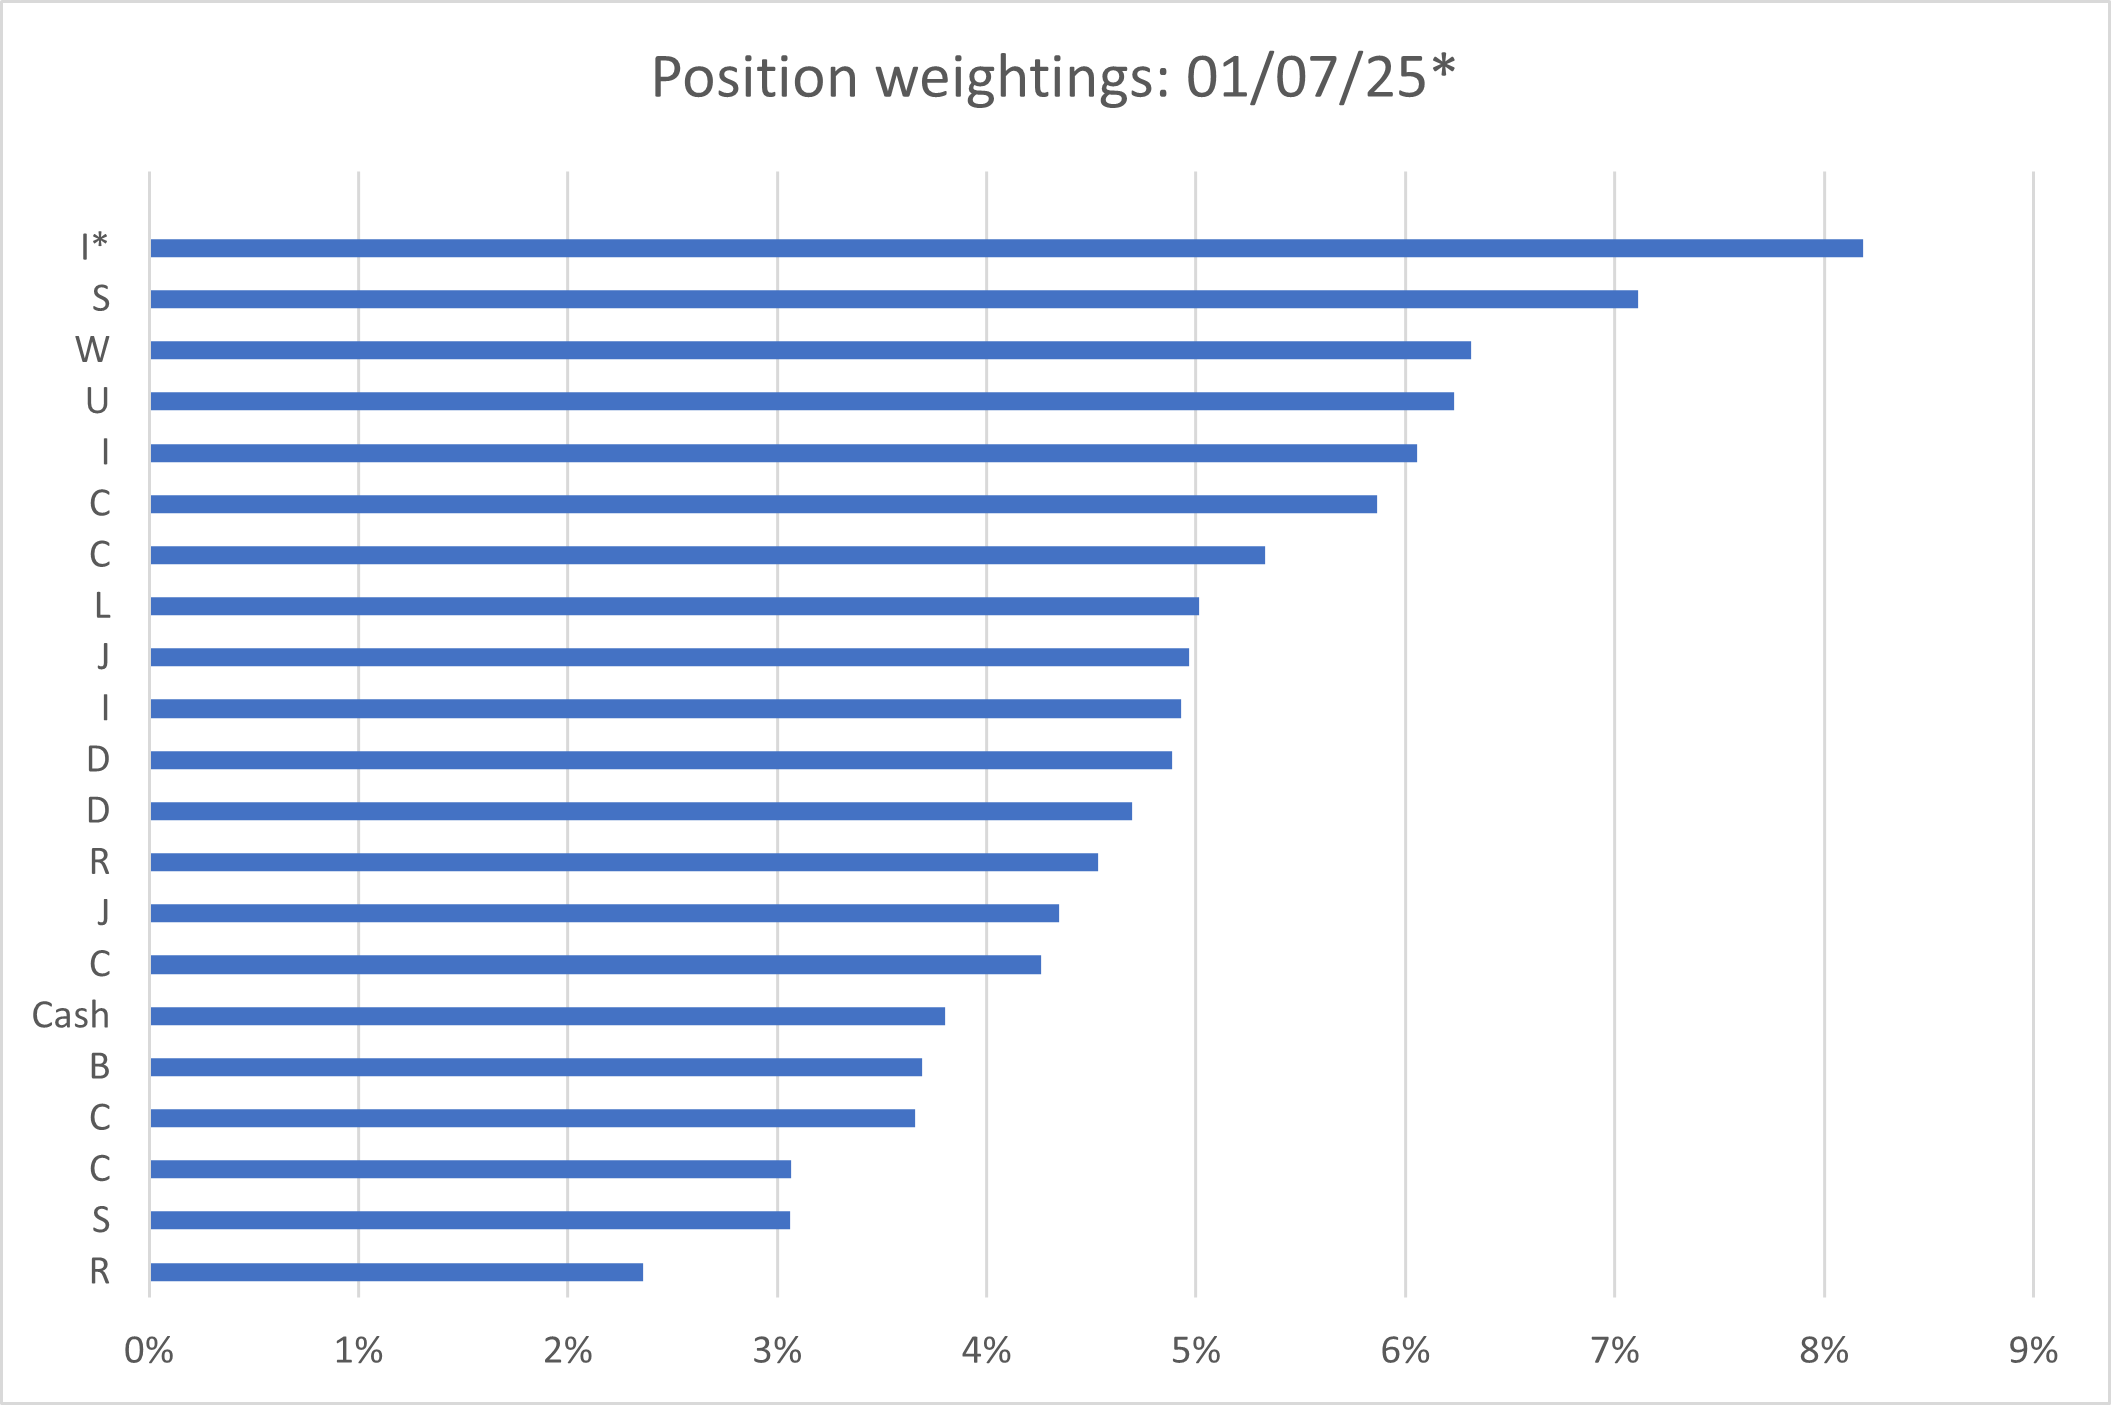
After top-slicing 'I' on 7 July, the portfolio's cash weighting has risen to over 6%.
I expect to use some of this cash to top up some existing positions later this year, probably in at the end of the third quarter. I'll share details of any planned purchases with subscribers prior to this.
Portfolio: key financial metrics
I like to think of investing as a portfolio sport. The performance of individual stocks is interesting and can provide satisfying dopamine hits. But wins (or losses) on individual stocks have limited value without considering overall portfolio performance.
In this final section of each quarterly review I take a look at the portfolio as if it was a single stock.
Although I this doesn't provide any protection from stock-specific issues, I find it a useful way of ensuring the companies in the portfolio still have most of the characteristics I'm look for.
It's also a useful way of tracking broad changes in the quality and valuation of the overall portfolio over time.
Here's how the portfolio looked at the end of June 2025:
| Date |
Median mkt cap |
TTM ROCE | TTM EBIT yield |
TTM FCF yield |
Net debt/5yr avg net profit |
TTM div yield* |
5yr avg div grth |
fc div yield* |
No. yrs div paid |
| 30 Jun 25 | £859m | 22.0% | 10.2% | 6.7% | -0.2x | 5.3% | 5.2% | 5.3% | 25 |
| 31 Dec 24 | £983m | 22.5% | 11.0% | 8.0% | -0.3x | 5.4% | 6.3% | 5.4% | 24 |
| 31 Dec 23 | £1,700m | 21.0% | 11.3% | 7.1% | 0.2x | 5.3% | 6.3% | 5.2% | 24 |
| 31 Dec 22 | £2,300m | 22.2% | 9.4% | 7.0% | 0.3x | 4.5% | 7.6% | 5.0% | 21 |
| 31 Dec 21 | £3,200m | 20.6% | 8.7% | 6.7% | -0.2x | 4.1% | 8.3% | 4.4% | 24 |
Scroll L-R (Data source: SharePad/author analysis. Some adjustments were needed. *Dividend yields were weighted to reflect position size from 2025 onwards. Prior to this they were simply averaged.)
Working from left to right, we can see that the portfolio's median market cap has continued to shrink this year, but its core profitability metric – return on capital employed – has remained stable. Note I substitute this with return on equity for financial stocks.
The valuation (EBIT yield & free cash flow yield) became slightly more expensive during the second quarter, reflecting rising share prices. However, I'd argue that an EBIT yield of 10% and FCF yield of nearly 7% remain attractive in valuation terms.
Continuing across the table, the companies in the portfolio have a small aggregate net cash position and offer a weighted average dividend yield (reflecting position sizes) of 5.3%.
Five-year average dividend growth of 5.2% supports my hope for continued above-inflation income growth. Income growth of 5.5% during the first half of this year seems encouraging to me in this regard.
Finally, the companies in the portfolio have paid unbroken dividends for an average of 25 years. While this period has included dividend cuts in some cases, I think it demonstrates a commitment to this form of shareholder return. This is important to me.
At some point I'd hope to see the average market cap of the portfolio edge higher again. But I am comfortable with this financial profile – if it was a single company, I would very likely be buying more shares in it!
Final thoughts
In my view, rising interest rates and the events that followed the war in Ukraine (higher energy prices & rising defence spending) were broadly favourable for many of the FTSE 100's largest names.
This may be a crude simplification, but I think this helps explain the outperformance of the big cap index over the last few years.
However, UK small and mid caps have historically outperformed the FTSE 100, at the cost of greater levels of volatility. I don't see any reason why this pattern shouldn't reassert itself over time.
This is a theme I touched on in more depth in an article at Stockopedia recently.
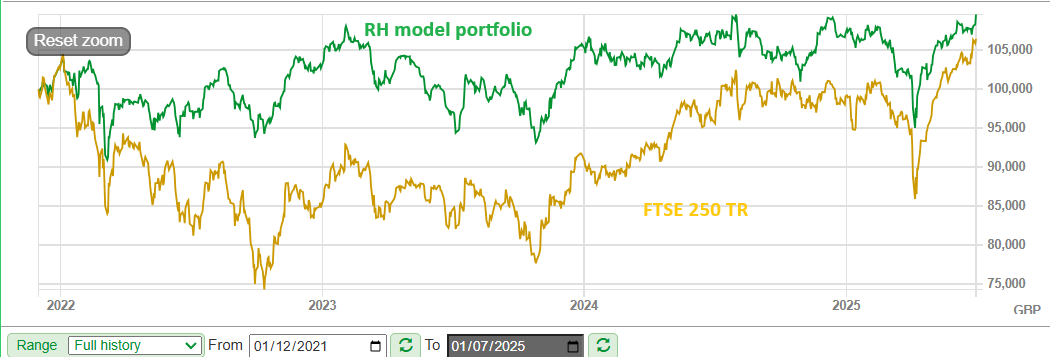
Unfortunately, the launch of my portfolio in December 2021 coincided with the start of a period of underperformance for the SmallCap and FTSE 250 indices:
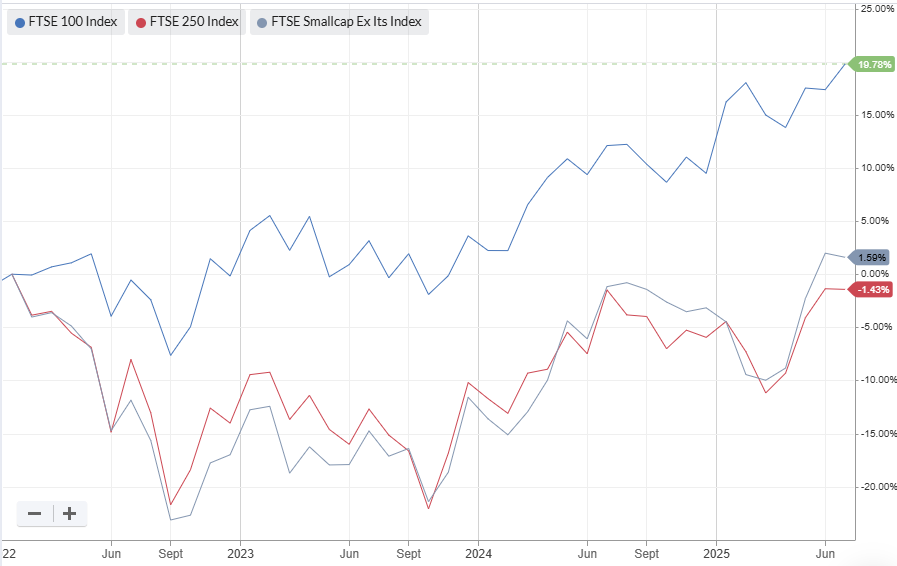
I am hopeful that we will see some mean reversion in performance from smaller companies over the coming months or years. Alongside this, I am cautiously optimistic that the companies in the model portfolio remain in decent health with good long-term prospects and (mostly) quite reasonable valuations.
The market gods may have other ideas, of course. We'll have to see what unfolds over the next quarter.
Until then, stay safe in the markets,
Roland Head
Disclaimer
This is a personal blog/newsletter and I am not a financial adviser. All content is provided for information and educational purposes only. Nothing I say should be interpreted as investing advice or recommendations.
You should carry out your own research and make your own investing decisions. Investors who are not able to do this should seek qualified financial advice. Reasonable efforts are made to ensure that information provided is correct at the time of publication, but no guarantee is implied or provided. Information can change at any time and past articles are not updated.