
Savills: is this property firm a good dividend share?
FTSE 250 real estate group Savills (LON:SVS) looks cheaper than it has done since 2008 according to several key metrics. Should I consider buying this dividend stock for my income portfolio?

Founded in 1855, Savills (LON: SVS) can probably claim to be one of the world's oldest real estate agents.
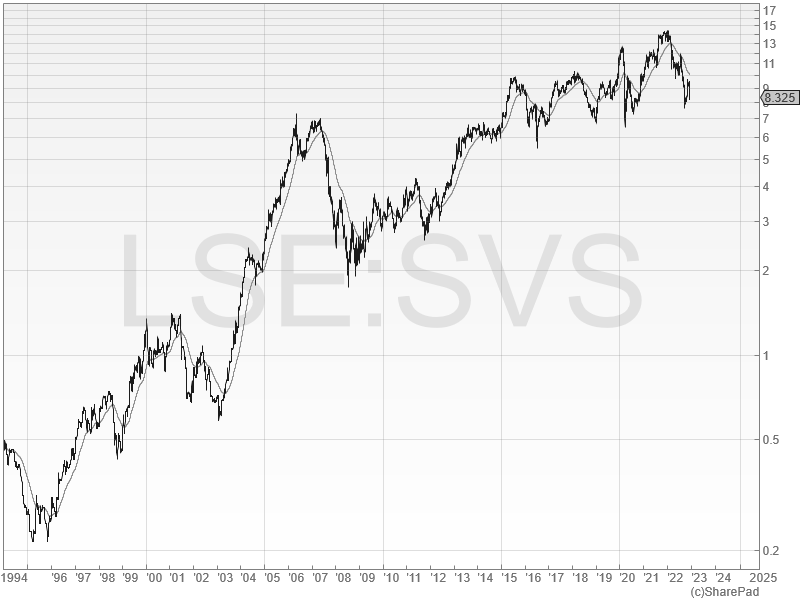
Investors who've bought shares in this 167-year old firm at almost any time over the 30 years have done well. Even this year's 40% sell-off has not had much impact on the long-term chart:
In this piece, I'll look at Savills' long-term track record of growth and consider why the shares have fallen so sharply this year. I'll also explain why I think this stock might be a suitable candidate for my quality dividend portfolio.
The story so far: Savills was founded by Alfred Savill in 1855. The new firm rapidly gained a foothold in the agricultural market, through advisory relationships with Essex landowners.
The business remained largely focused on the rural sector until the 1950s, when Savills merged with Rees-Reynold and Hunt, a commercial property specialist.
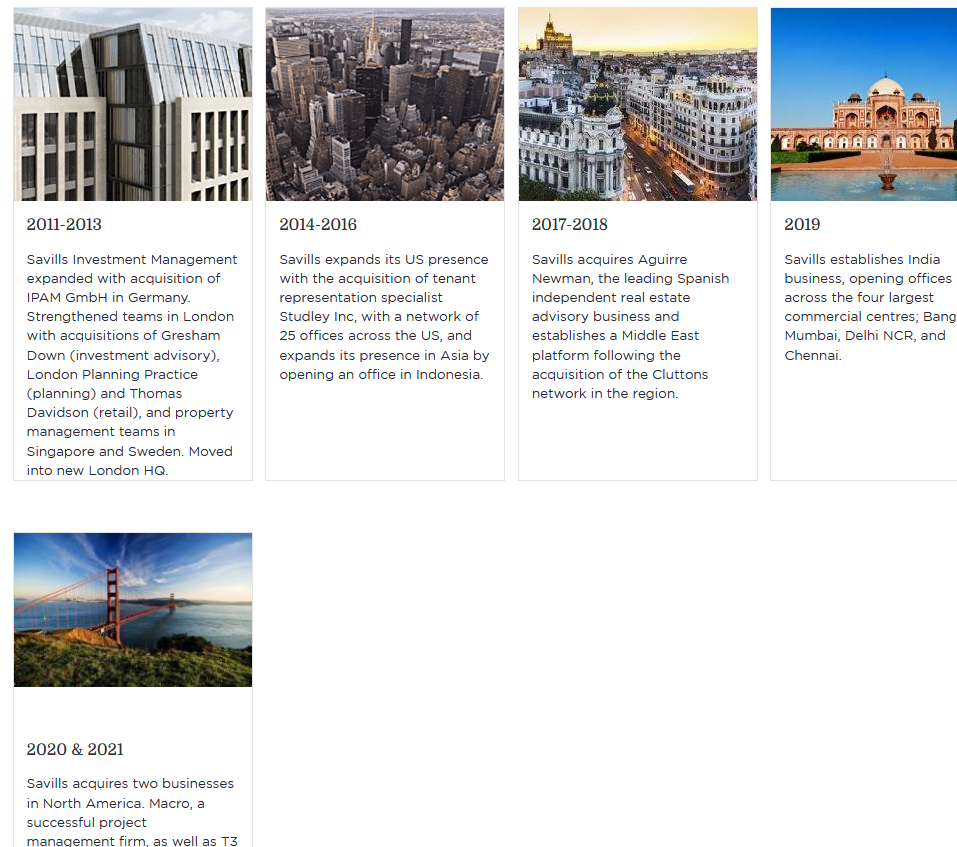
In 1988, Savills abandoned its partnership model and floated in the London Stock Exchange. Over the 34 years since then, the group has expanded into Asia, continental Europe, the US and the Middle East.
In most cases, Savills acquired established companies in each market to provide immediate scale, rather than starting from scratch.
Today the group's offering is built around a mix of residential and commercial property. Services offered include investment and property management, in addition to more traditional transactional and consultancy work.
Although real estate is essentially a people business, I believe Savills' scale, longevity, and strong brand may have created a lasting competitive advantage. The company describes it in this way:
Irrespective of location, our people form part of a wider integrated network that enables them to provide our clients with access to market intelligence, contacts and the highest quality advice.
Rising interest rates prompt rethink
A recent article in the FT (paywall) by legendary US investor Howard Marks caught my eye.
Marks – whose firm Oaktree Capital manages over $160bn – reckons that high inflation and rising interest rates may have triggered a sea change in market conditions. He thinks this could have a broad impact on investment conditions over the coming years.
I mention this here because I think it's fair to assume that Savills' growth over the last decade has benefited from falling interest rates and asset price inflation. While I'm sure that the firm would have traded successfully even without ultra-low rates, my guess is that progress would have been slower.
In its half-year results, management admitted that rising interest rates were "a new experience for many market participants". The company says that "the risk is towards a short term reduction in activity as markets adjust to [...] rising debt cost".
I think the significance of these changing conditions is easier to understand with the help of this SharePad chart, which shows the Bank of England base rate since 1982:
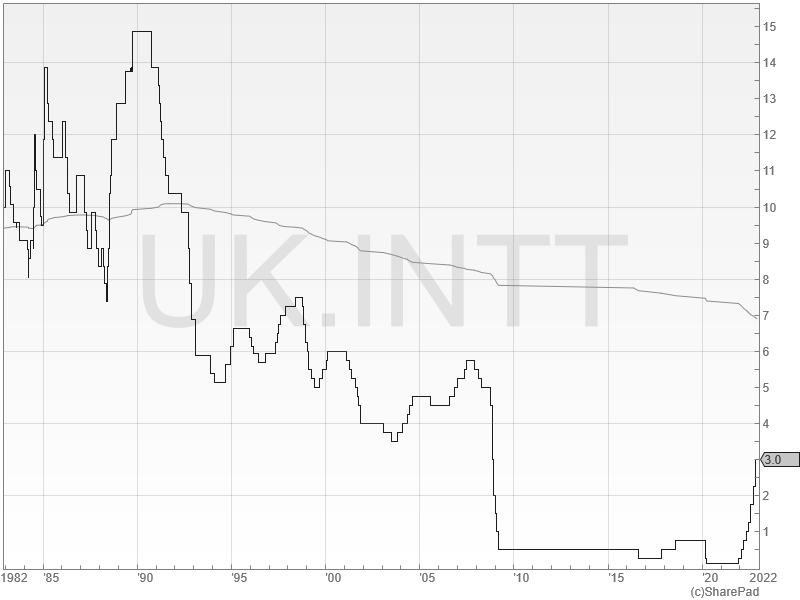
Buyers of super-prime homes in London and large country estates may not be worried about rising mortgage rates. But for mid-market residential customers, I'd guess that interest rates are still significant.
However, I think the larger impact from rising rates will be in commercial property, where investors rely heavily on debt markets. Logically, higher borrowing costs mean either that rental rates must rise, or property prices must fall.
It seems very likely to me that commercial property prices and transaction levels will fall, at least temporarily, while the market finds a new balance. That could hit Savills' revenue from property transactions.
Markets are certainly pricing in a more downbeat outlook. Savills' share price has fallen by 20% since August's half-year results, and by 40% from the record high seen at the start of this year:
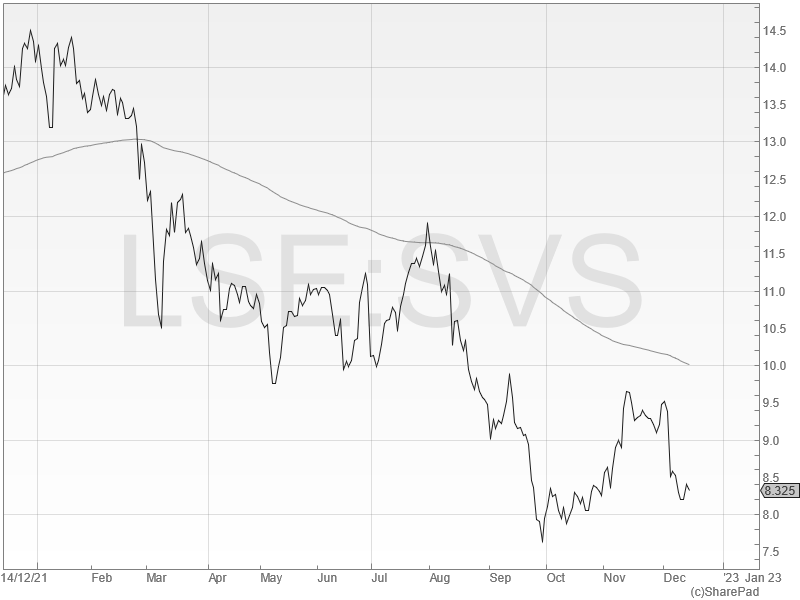
This slump has left stock trading on 11 times forecast earnings, with an expected dividend yield of 3.9%.
I'm intrigued. The shares are cheaper than I've seen them in for a long time, and Savills is now one of the highest-scoring stocks in my screening system.
Is this the kind of quality dividend stock I should be targeting for my portfolio?
Savills: crunching the numbers
Description: international real estate agency and advisory business.
| Savills (LON: SVS) | Quality Dividend score: 78/100 | Forecast yield: 3.9% |
| Share price: 832p | Market cap: £1.2bn | All data at 14 December 2022 |
Latest accounts: results for the half year ended 30 June 2022
In the remainder of this review, I'll step through the different stages in my dividend screening system and explain whether I think Savills could be a suitable addition to my quality dividend portfolio .
Unless specified otherwise, the financial data I use in this process is drawn from SharePad.
Dividend culture: beyond doubt
I score companies' dividend culture by simply looking at how many consecutive years they've paid dividends for.
My focus here is on continuity; how deeply embedded in the company's culture and capital allocation strategy is the dividend?
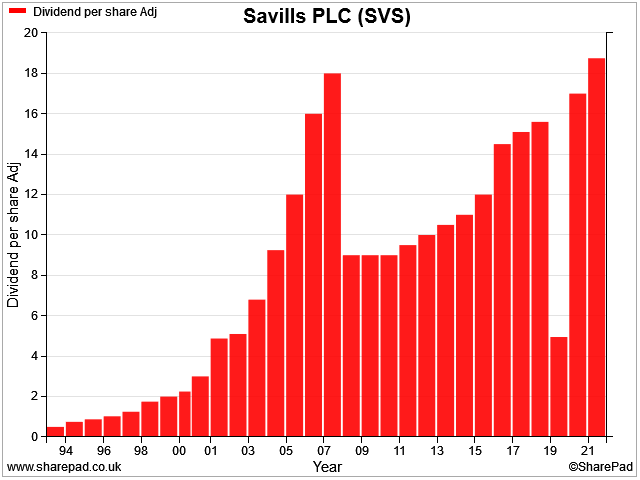
Savills achieves a perfect score here, with a 30-year track record of continuous dividend payouts.
As far as I can see, there's only been one cut, in the 2008 financial crisis (the 2020 payout was made up in 2021, although that's not shown here).
Savills scores 5/5 for dividend culture in my screening system.
Dividend safety: strong
A dividend that's not backed by rising earnings and free cash flow may be at risk of a cut.
For this test, I look at dividend cover by both earnings and free cash flow. I also check the level of debt leverage in the business.
My goal is to flag up unsupportable payouts, but perhaps more importantly I'm looking for a worsening trend of affordability.
For example, if a company's payout ratio has increased steadily from 50% to 80% over a period of years, it could signal that the dividend is growing too fast and may become unsupportable.
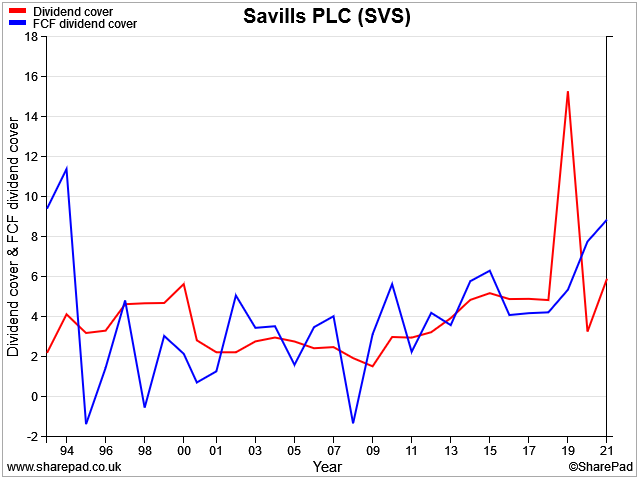
Reassuringly, that's not the case at Savills. Dividend cover has trended between two and four times earnings for much of the last 30 years. Free cash flow dividend cover has also been solid, bearing in mind that FCF is typically more volatile than accounting earnings.
Leverage has also been consistently low. Indeed, Savills has reported a net cash balance for most of the last 30 years. The recent increase reflects the 2019 change to IFRS 16 lease accounting, rather than any sudden increase in financial debt:
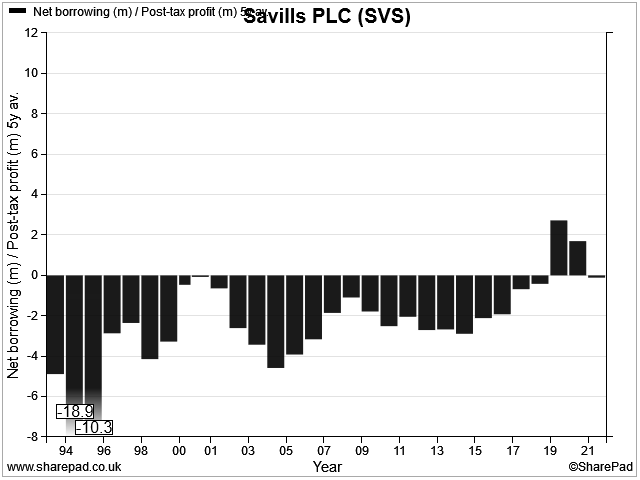
Savills' payout looks safe to me, barring a major collapse in earnings.
Savills scores 3.7/5 for dividend safety in my screening system.
Dividend growth: solid foundations
In my view, good quality dividend growth should be representative of growth in the underlying business. When this is true, the dividend should be sustainable.
On the other hand, if a company is merely paying out an increasing share of its earnings each year, then dividend growth is likely to hit a wall at some point.
To score a stock for the quality of its dividend growth, I compare the dividend growth rate with the growth of free cash flow per share and net asset value. In my opinion, these two metrics provide a good indicator of how sustainable dividend growth might be.
Here's how these metrics look on a chart, plotted against the firm's dividend:
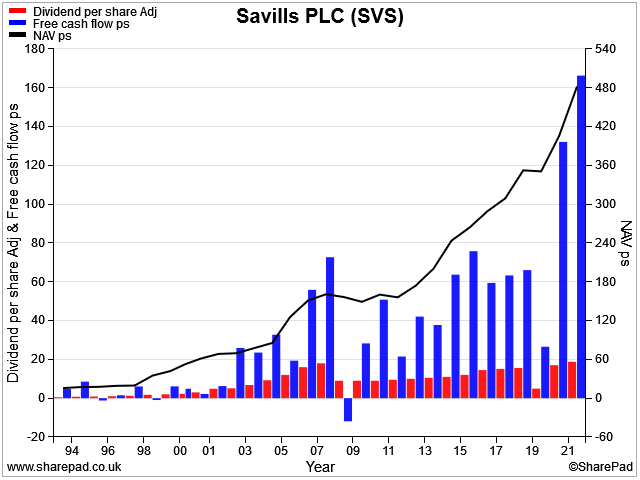
What this tells me is that Savills returns an affordable portion of its free cash flow each year, while maintaining a prudent cash balance and reserving funds to support future growth.
Arguably, we might question whether the company could consider paying larger dividends. The relatively low rate of dividend growth is the main reason why my system doesn't score the shares more highly in this category.
However, given the company's long track record and the uncertain outlook for commercial property right now, I'd be content as a shareholder to know that the payout has a healthy margin of safety.
Savills scores 3.7/5 for dividend growth in my screening system.
Dividend yield: not a high yielder
Savills conservative dividend payout ratio means that it's rarely been a high-yield stock. The yield has not topped 3% since the financial crisis, according to SharePad.
Payouts were disrupted during the pandemic, but this chart doesn't seem to reflect a make-good special dividend that was paid in May. To give a more accurate indication of the expected running yield of this stock, I've included forecast dividends.
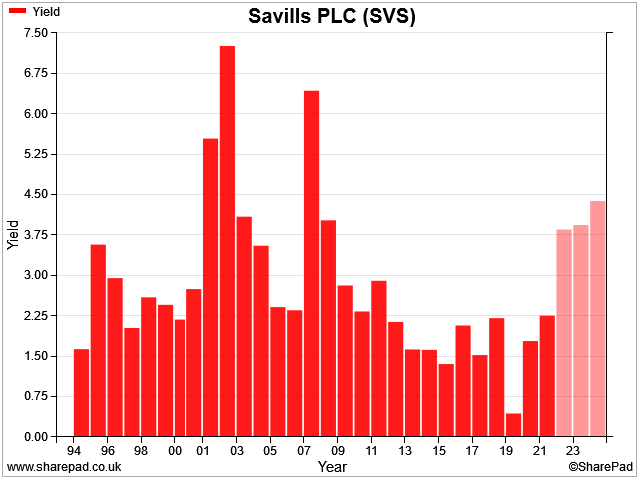
Assuming that the company pays dividends as forecast, the forecast dividend yield on the stock is at a level last seen during the financial crisis. This suggests to me that Savills' valuation might have fallen to an attractive level for a long-term entry.
However, the stock's history of low yields means it scores poorly in this category.
Savills scores 1.4/5 for dividend yield in my screening system.
Valuation: attractive
I score stocks for valuation based on their EBIT yield and free cash flow yield. This enables me to see how the business is valued relative to its operating profit, and whether this profit is reliably convered to free cash flow.
The picture here is pretty good. Since the financial crisis, at least, Savills appears to have reliably convered most of its operating profit into surplus cash each year.
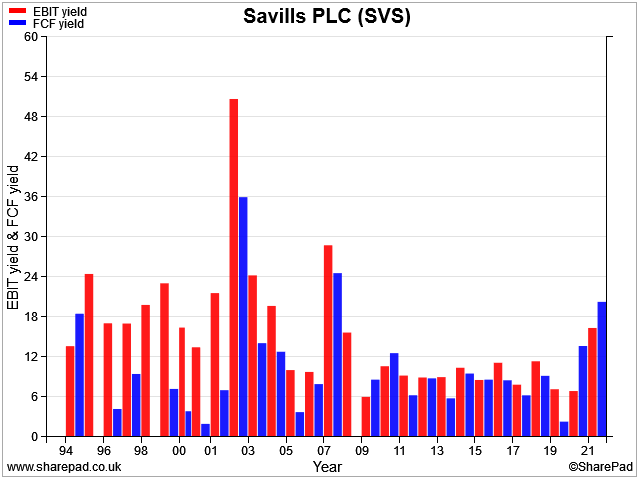
Moreover, the stock's EBIT and FCF yields are both well above the 8% threshold I use as a rule of thumb for good value. Forecasts suggest a lower result this year than in 2021, but the valuation still looks attractive to me, barring a complete collapse in profits.
Cyclical earnings: I don't generally use the P/E ratio in my screening because I prefer measures that reflect debt and/or cash generation. However, I do find cyclically-adjusted earnings to be a useful valuation tool for cyclical stocks.
The measure I generally use is the CAPE, or cyclically-adjusted price to earnings ratio. This averages inflation-adjusted earnings over 10 years, and compares this figure to the current share price.
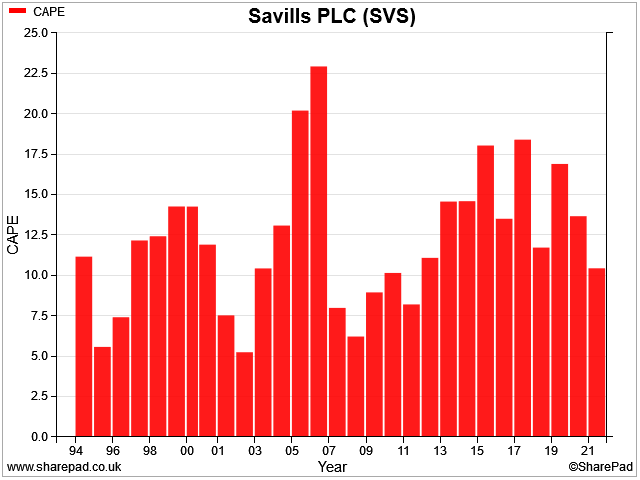
Savills currently has a CAPE of 10.5, according to SharePad. That's the lowest value seen since 2011, giving me some confidence that the valuation could be attractive on a cyclical basis – i.e. reflecting peak-to-trough earnings.
The caveat here is that if we are entering a new era, as Howard Marks suggests, the trough could be a little lower than expected.
Savills scores 4.5/5 for valuation in my screening system (which does not currently include CAPE).
Profitability: high
I look for companies with above-average profitability, as I expect these to be more likely to outperform the wider market over long periods.
For non-financial companies, I use return on capital employed (ROCE) as my main measure of profitability. Although operating margin is also useful, it doesn't capture how much value a business is creating each year in the way that ROCE does.
In this chart I've plotted ROCE and net asset value per share for Savills since 1993. We can see how a high ROCE has supported continual NAV growth, despite the company's record of dividend returns and regular acquisitions.
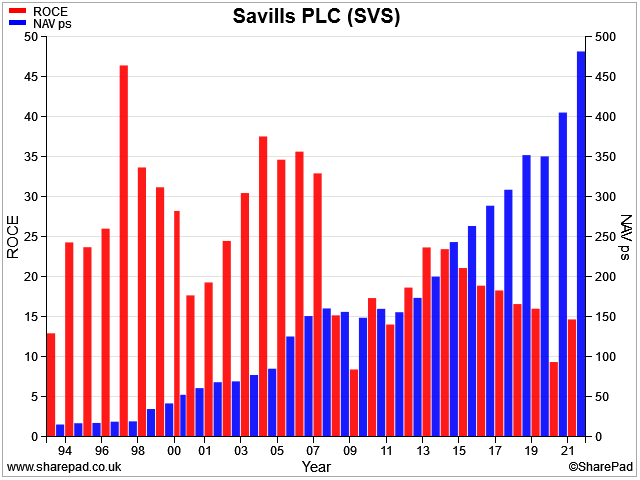
However, it's notable that ROCE has fallen steadily from 24% in 2013 to 14% last year. My suspicion is that much of this decline relates to a string of acquisitions that have taken place during this time.
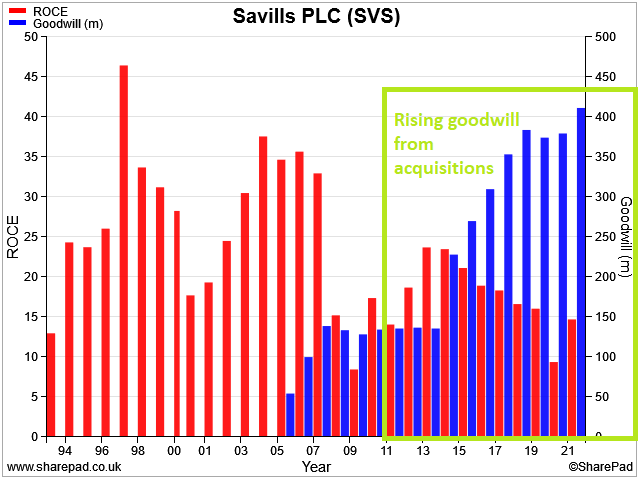
In a worst-case scenario, we could shortly discover that Savills overpaid for these acquisitions and that they aren't very profitable. However, I don't think that's the problem.
In my view, a more likely explanation is that these deals resulted in more than £400m of goodwill being added to Savills' balance sheet, increasing capital employed and thus decreasing returns (ROCE = EBIT / Capital Employed)
Acquisitions with significant goodwill often reduce ROCE, because equivalent internally-generated assets do not require goodwill to be added to the balance sheet.
For example, my sums suggest Savills would have generated a 2021 ROCE of 18% if goodwill was excluded from the balance sheet, instead of the 15% actually reported.
There are accounting treatments to neutralise the effect of acquisitions, but I don't (currently) use these in my scoring system.
However, Savills' trailing ROCE is still well above average, and high enough to be attractive to me.
On balance, I'm comfortable that this is a profitable business with a track record of creating value for its shareholders.
Savills scores 4.2/5 for profitability in my screening system.
Fundamental health: very strong
My fundamental health score aims to pick up areas not covered elsewhere in my system – primarily leverage.
The two metrics I use here are:
- Net debt/5yr average after-tax profit
- Fixed charge cover - how easily a company can pay its rent, lease and interest costs from its operating profit.
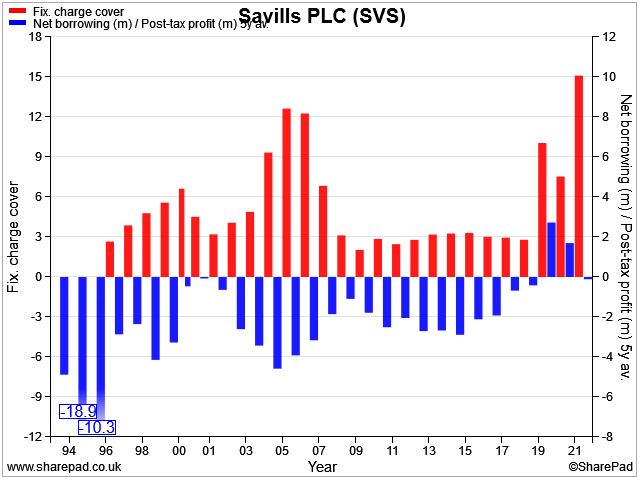
Leverage: I choose to compare net debt with after-tax profit, rather than EBITDA. The main reason for this is that it gives me an idea of how easily a company might be able to repay its debt from genuine excess profits. That's not the case with EBITDA, from which many expenses must be deducted to allow a business to operate sustainably.
As a rule of thumb, I target a maximum leverage multiple of 4x, although the impact of IFRS 16 lease accounting on reported net debt means that I'm more flexible on this than I used to be.
I don't have any concerns about the health of Savills' balance sheet or its use of debt.
Savills scores 5/5 for fundamental health in my screening system.
Conclusions: quality at a reasonable price?
My quality dividend system awards Savills an overall score of 78/100 at the time of writing (December 2022).
In my view, Savills appears to be a well-run business with above-average profitability. I think it could potentially have a small economic moat, thanks to the network effects provided by its reach, brand and longevity.
My only serious concern is that the impact of rising borrowing costs might be greater and take longer to play out than the market is currently recognising. The UK base rate of 3.5% (at the time of writing) is still low by historic standards, but it's much higher than most market participants are used to.
Rising borrowing costs may mean that the relationship between commercial property prices, rent, and leverage needs to be recalculated. It could be a bumpy road for a while.
My view: However, while I'm cautious, I also think that a lot of the bad news is already in the price at Savills. On balance, I would be comfortable starting to build a long-term position in this stock.
It's impossible to time the bottom, but I'm very confident that this 167-year old firm will weather this storm, as it has done many times previously. I expect Savills to remain a market-leading firm that can provide attractive returns to long-term shareholders.
If I didn't already own shares in this housebuilder, then Savills would certainly be on my shortlist of stocks to buy for my portfolio to replace EMIS, which is being taken over.
Disclaimer: My comments represent my views only. I am not a financial adviser. The information provided is for information and interest. Nothing I say should be construed as investing advice or recommendations. The investing approach I discuss relates to the system I use to manage my personal portfolio. It is not intended to be suitable for anyone else.
You should carry out your own research and make your own investing decisions. Investors who are not able to do this should seek qualified financial advice. Reasonable efforts are made to ensure that information provided is correct at the time of publication, but no guarantee is implied or provided. Information can change at any time and past articles are not updated.