
Q1 2026 dividend portfolio review: a poor start
My portfolio underperformed the FTSE 100 during the first quarter but dividend income remains stable and the portfolio's quality and valuation metrics remain good, in my view.


The first quarter of 2026 brought its share of surprises. The impact on UK share portfolios varied, mostly depending on the level of exposure to energy, defence and mining.
In this review I'll look at the performance of my dividend portfolio in Q1. Spoiler alert: I don't own many energy, defence or mining stocks.
As a quick reminder, the dividend portfolio documented on this website is a model portfolio that largely mirrors my main personal investments. My main goals are to:
- Generate a dividend yield greater than the FTSE 100;
- Provide inflation-beating income growth.
This strategy is based on the hypothesis that steady income growth should lead to corresponding long-term share price growth, as stocks re-rate to maintain stable yields. In theory at least, this should mean enjoying useful capital gains over time, while also receiving a rising income.
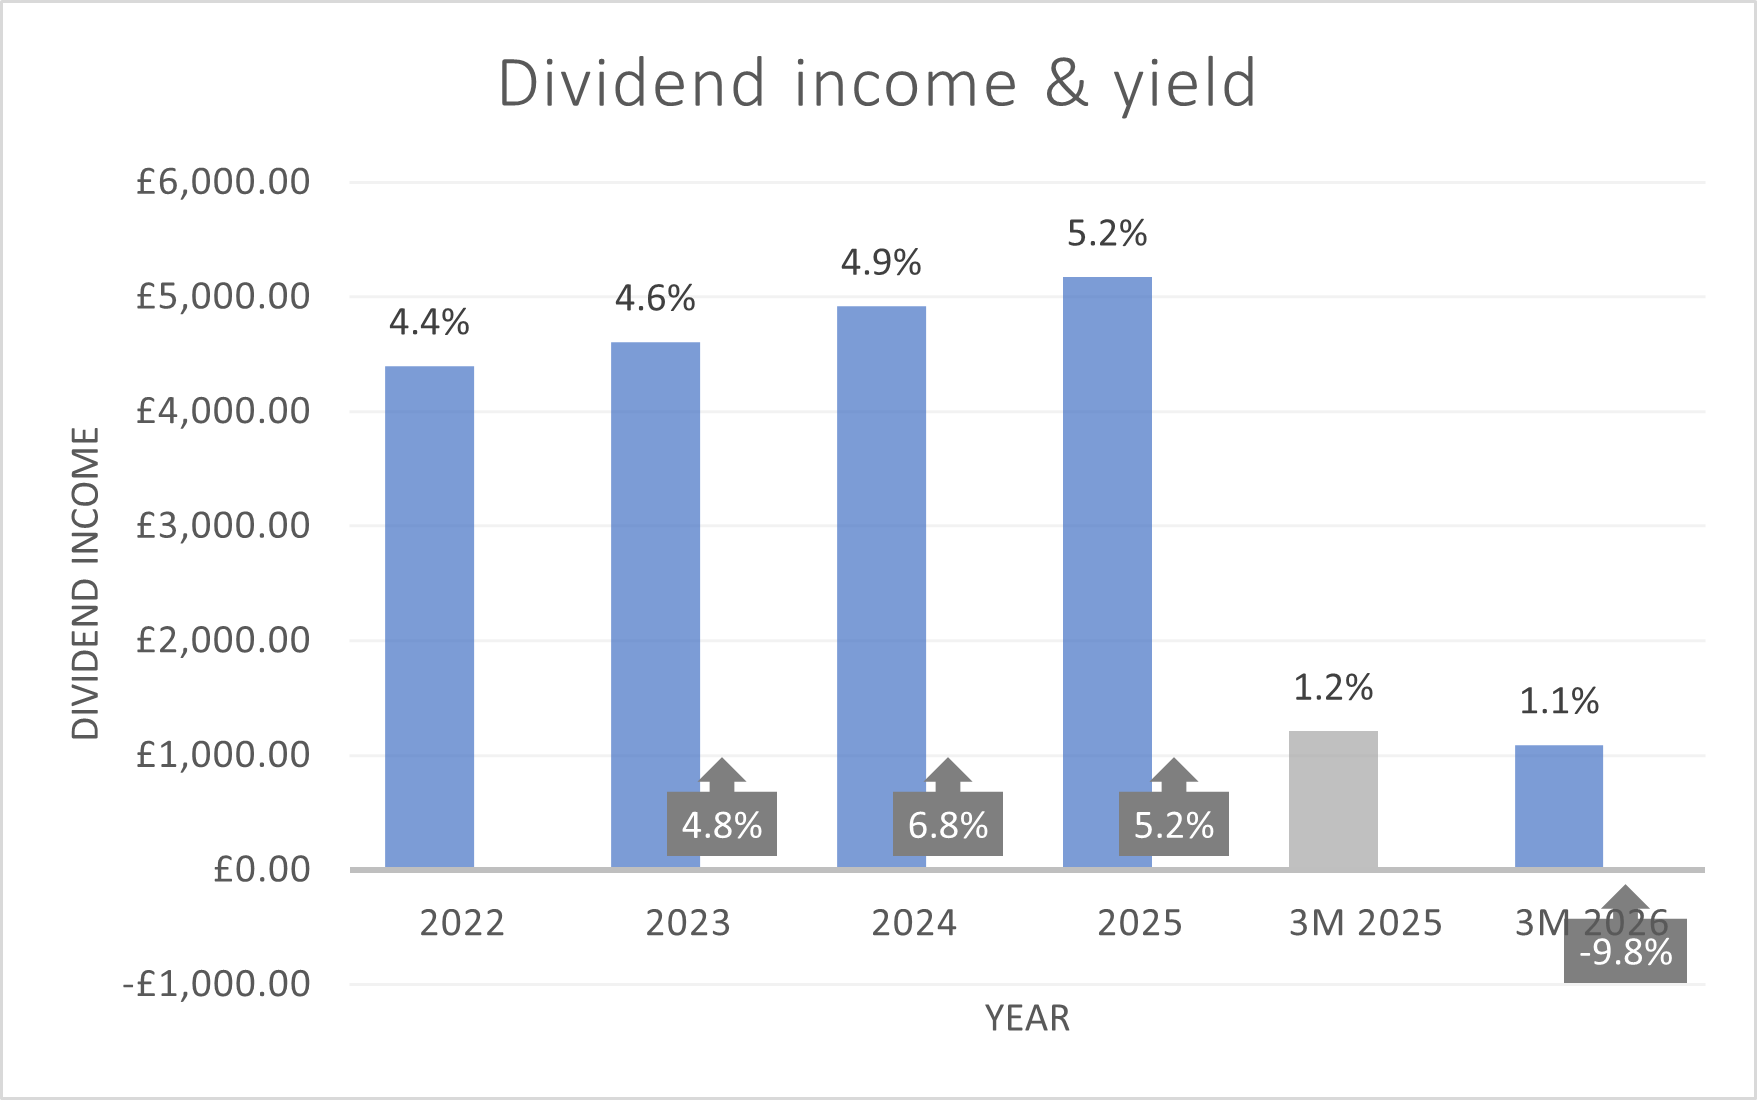
So far, the portfolio has generated rising income in each year since its inception in 2021.
Although dividend income fell slightly during Q1 when compared to the same period last year, the first quarter typically provides less than a quarter of the portfolio's full-year income.
I am not too concerned about this shortfall at this point. I'm also hopeful that some recent top-up purchases will bolster income receipts during the remainder of the year.
In the remainder of this review, I'll take a closer look at the portfolio's performance in Q1, summarise recent top up trades and update my record of the portfolio's key financial metrics.
- Q1 2026 performance review
- Portfolio changes in Q1
- Position weightings
- Key financial metrics for the portfolio
- Final thoughts
Q1 2026 performance review
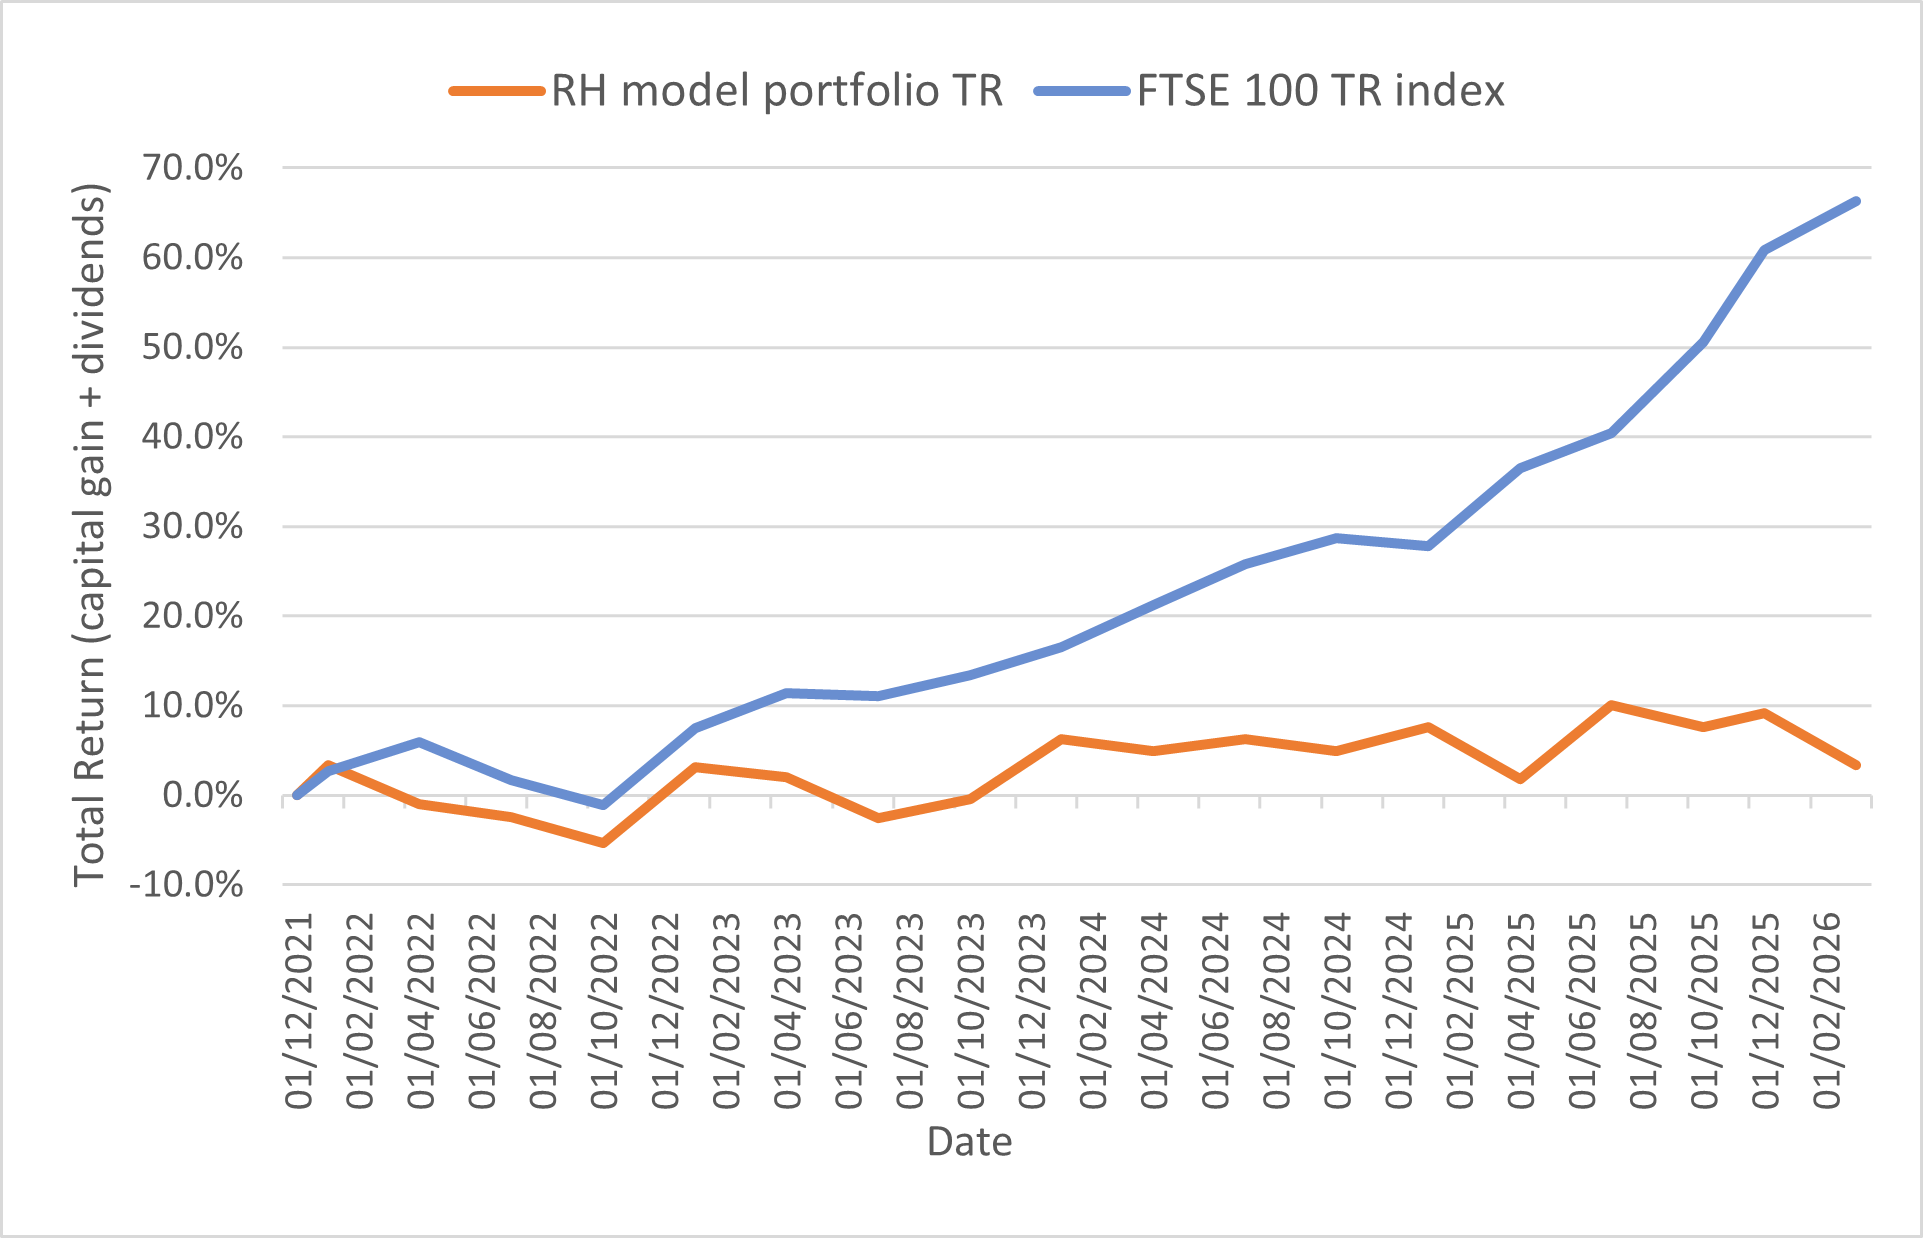
There's no way to put a positive spin on this. By the time markets closed on 31 March 2026, my model portfolio had underperformed the FTSE 100 total return index by 8.8%.
Q1 2026 performance:
- RH model portfolio total return: -5.4%
- FTSE 100 Total Return index: +3.4%
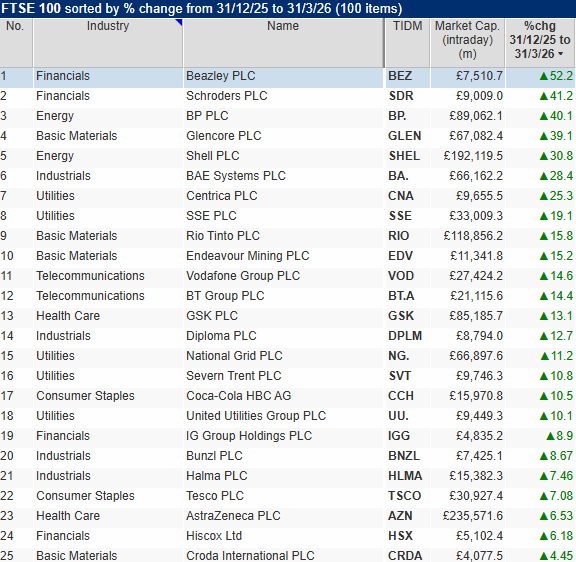
Although only 38 of the companies in the FTSE 100 rose in Q1, the largest gains were concentrated in some of the largest companies, driving the market higher. Unfortunately, only one of the stocks listed below is a member of my portfolio (although it is one of my two largest positions):
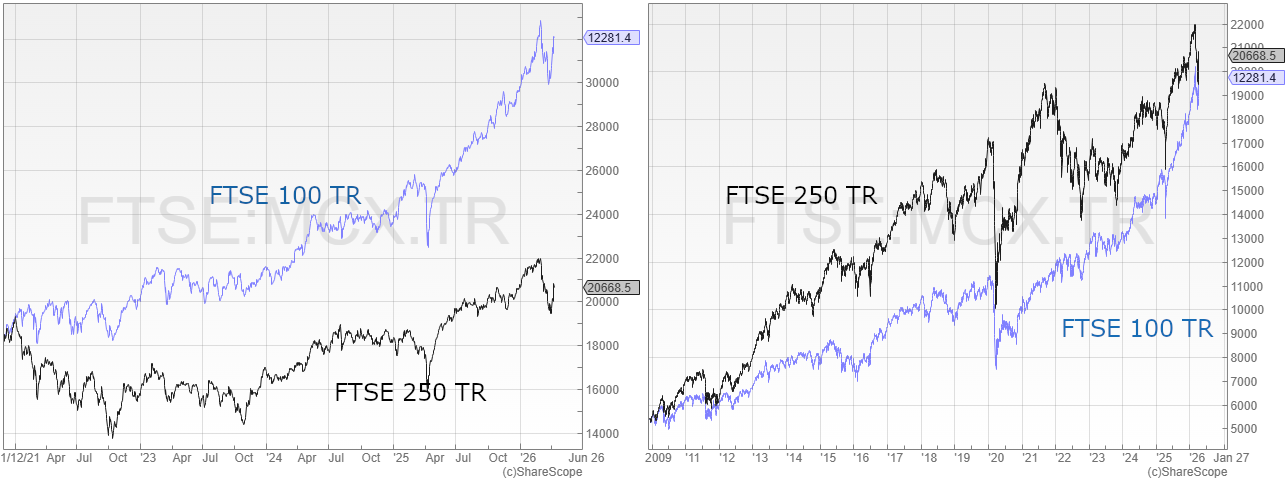
The chart below shows the model portfolio's performance against the FTSE 100 TR since the portfolio's inception in December 2021:
The extent to which the FTSE 100 has outperformed the remainder of the UK market over the last five years is made clear by comparing my portfolio with a different benchmark. Over the same period as shown in the chart above, my performance is almost level with the FTSE 250 total return index:
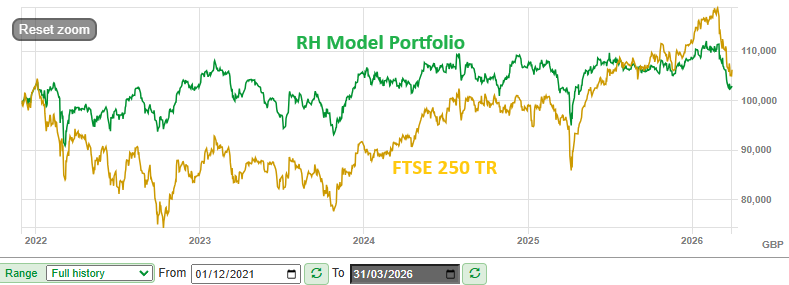
Historically, the FTSE 100 and 250 have been more equally matched. My hope remains that the UK's small and mid-caps will reassert themselves over time:
Unfortunately, the portfolio's small and mid-cap exposure meant it was more heavily exposed to the market sell-off that followed the start of the Middle East conflict. Just four of my stocks (out of 19) logged positive share price performances in Q1:
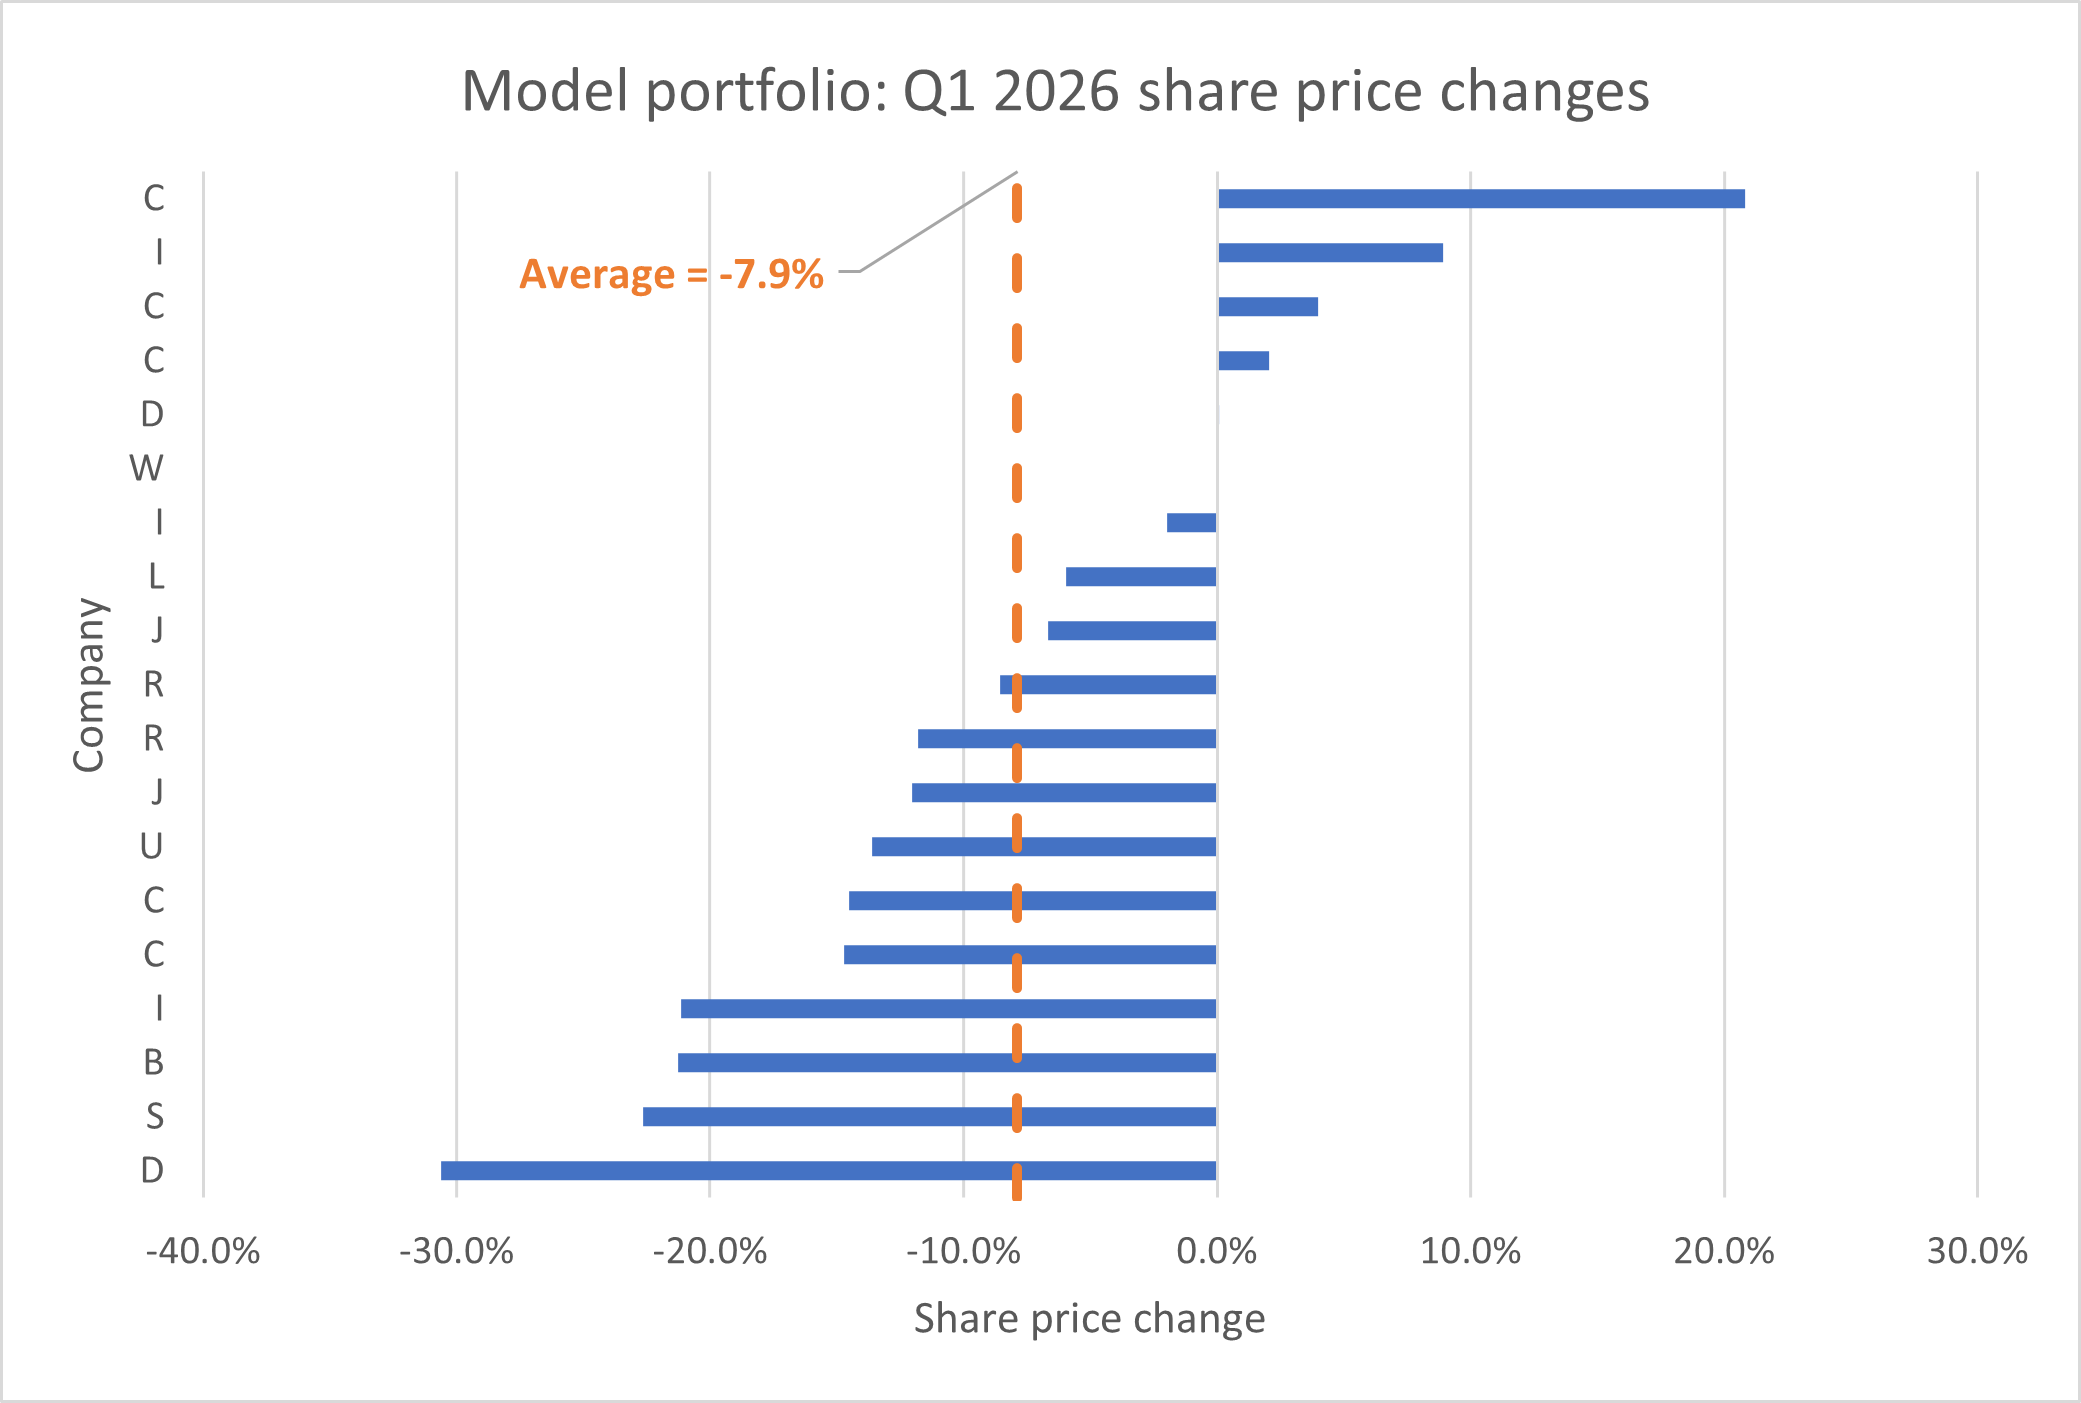
While only three stocks saw material cuts to consensus earnings forecasts in Q1, sentiment was poor and many shares de-rated and became cheaper. As a result, I decided to adds to some holdings at the end of the quarter.
Instinctively, I find my temperament is better-suited to averaging down than cutting losers quickly. Whether this will eventually prove to be a winning approach is a different question.
Portfolio changes in Q1 2026
No new stocks were added to the portfolio during the first quarter and no shares were sold.
I did continue to use accumulated dividend income to top up existing holdings. Following on from a record seven top ups at the end of December, I added to three positions at the end of March:
- A FTSE 100 financial with an 8%+ dividend yield;
- A biotech stock with potentially exciting prospects and an 8% yield;
- A FTSE 100 industrial group that's in the global top four in its sector.
Subscribers can see full details of these purchases and my thoughts on each company's recent results in my March write-up.
Position weightings
Here's a snapshot of how the model portfolio looked following these top ups, on the 1 April 2026 (paid subscribers can see this chart with company names on my portfolio page):
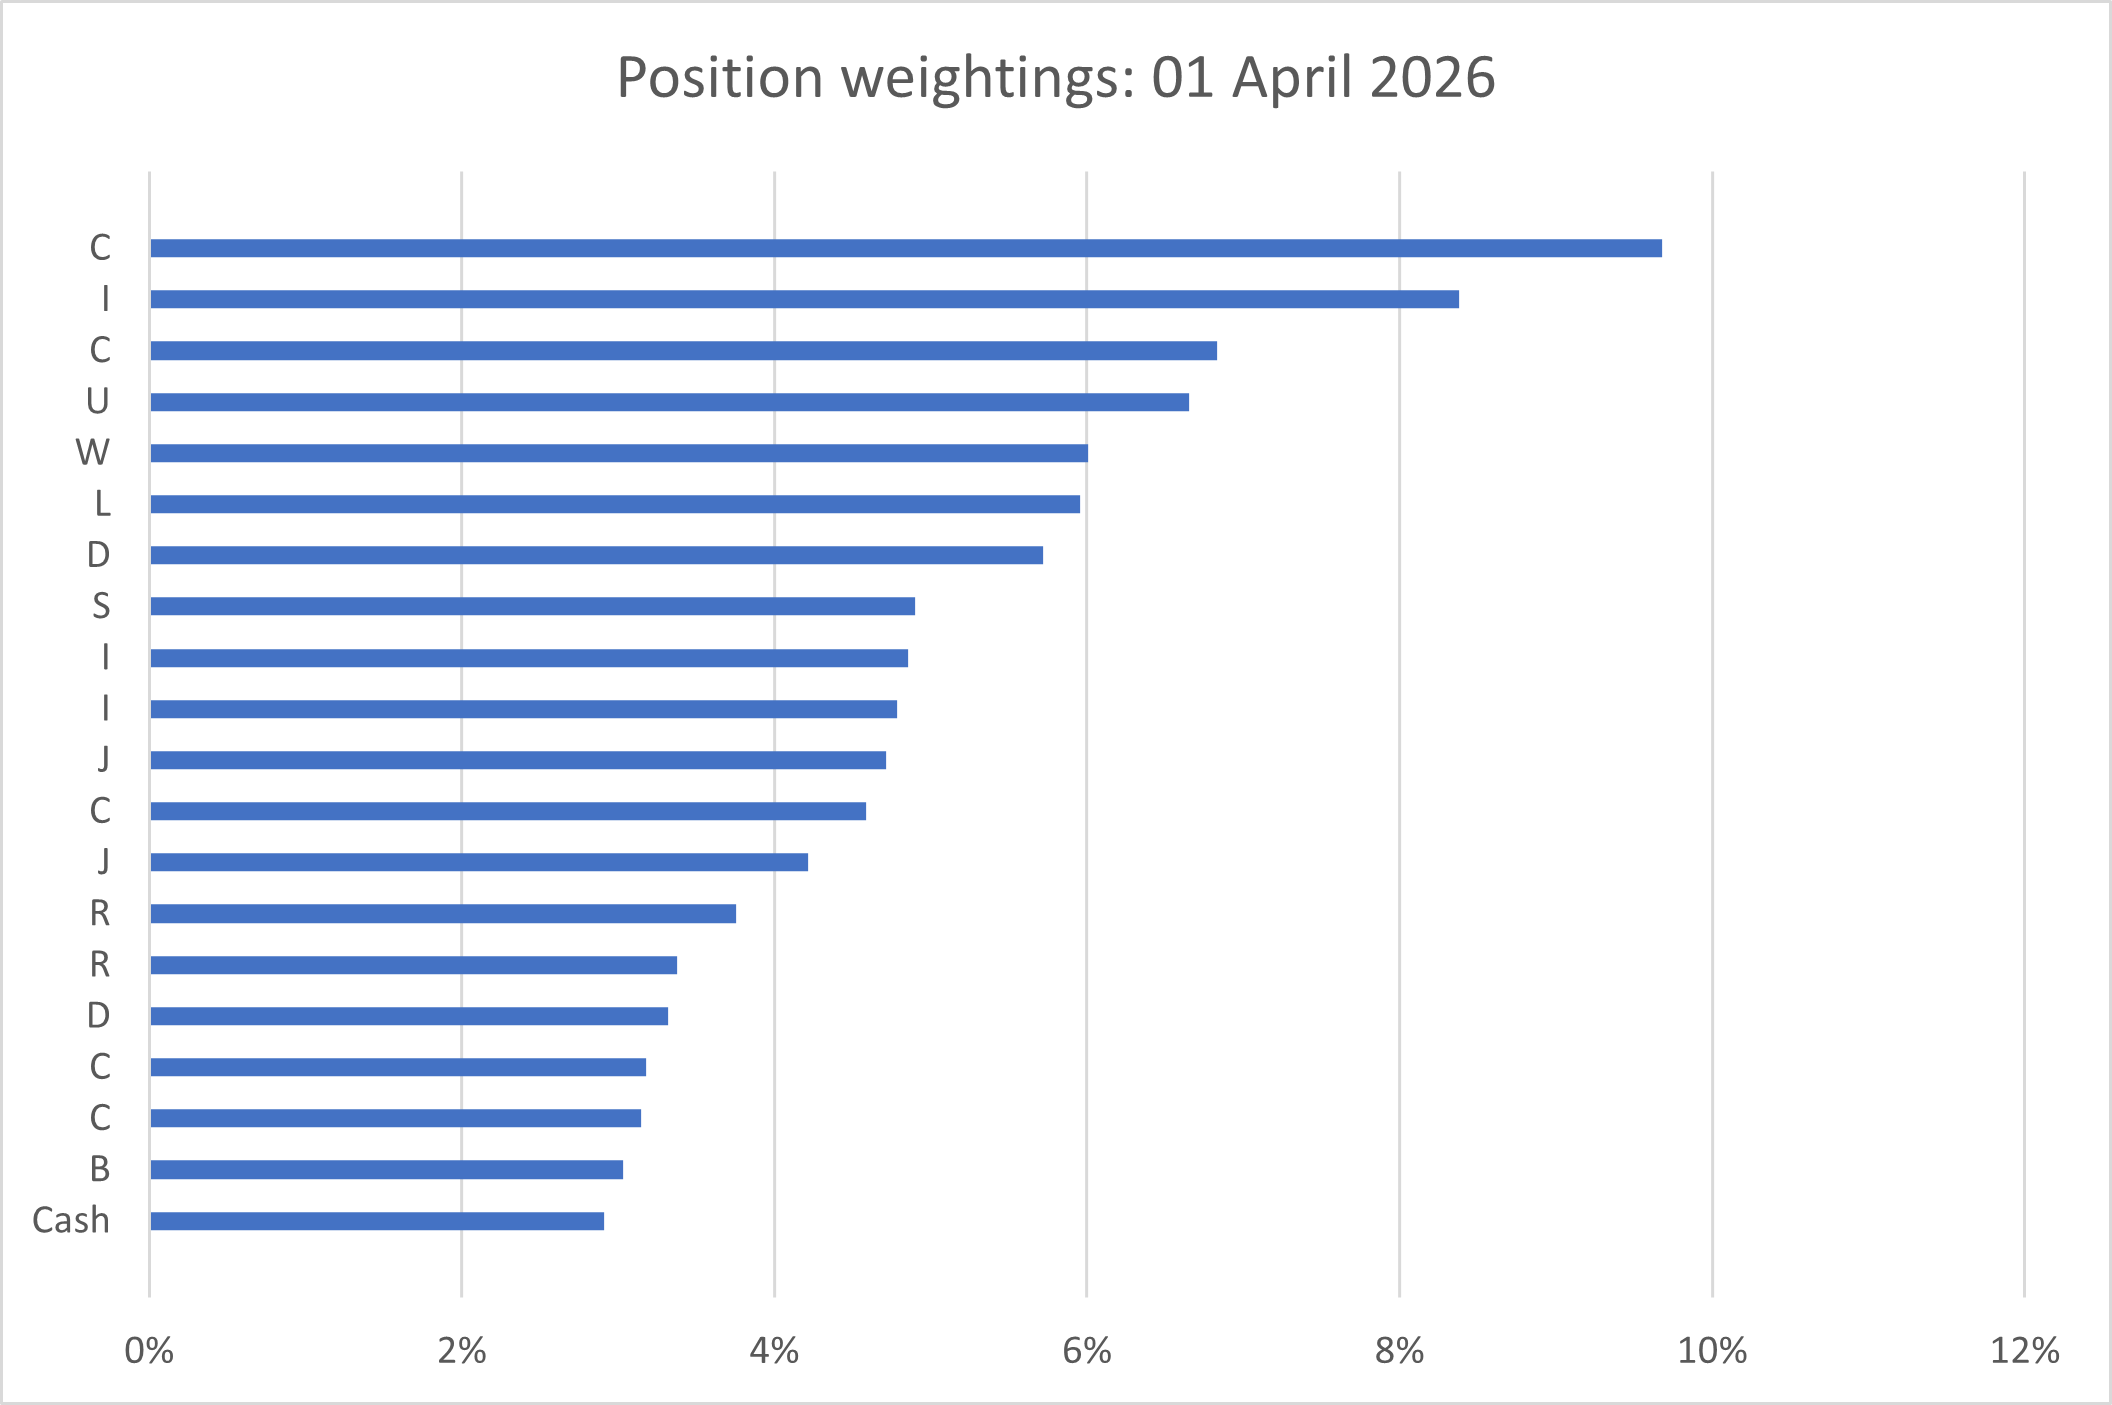
The portfolio was originally conceived with a fixed target of 20 stocks, but it's only had 19 since the sale of Somero Enterprises in September.
I have not yet added back a 20th stock to the portfolio and I'm undecided if I will. I am inclined to move to a more flexible approach targeting 15-20 stocks. Although I have some ideas for one or two new positions, I'm also considering trimming some other underperformers as the year unfolds.
Time permitting, I hope to look at some potential dividend stock ideas in some new share reviews in the coming months.
Portfolio: key financial metrics
Using an approach borrowed from Terry Smith (and others), I like to calculate average metrics for all of my stocks so that I can view the portfolio as it if was a single company.
Doing this allows me to track any changes in the overall profile of the portfolio and gauge whether – in aggregate – the stocks I hold have the characteristics I'm targeting.
Here's how the model portfolio looked on 31 March 2026:
| Period end | 31 Dec 21 | 31 Dec 22 | 31 Dec 23 | 31 Dec 24 | 31 Dec 25 | 31 Mar 26 |
| Median mkt cap | £3,200m | £2,300m | £1,700m | £983m | £1,230m | £1,460m |
| TTM ROCE | 20.6% | 22.2% | 21.0% | 22.5% | 20.2% | 21.1% |
| TTM EBIT yield | 8.7% | 9.4% | 11.3% | 11.0% | 8.7% | 9.0% |
| TTM FCF yield | 6.7% | 7.0% | 7.1% | 8.0% | 6.4% | 7.5% |
| Net debt/5yr avg net profit | -0.2x | 0.3x | 0.2x | -0.3x | 0.0x | 0.2x |
| TTM div yield* | 4.1% | 4.5% | 5.3% | 5.4% | 5.1% | 5.6% |
| 5yr avg div grth | 8.3% | 7.6% | 6.3% | 6.3% | 5.0% | 5.0% |
| fc div yield* | 4.4% | 5.0% | 5.2% | 5.4% | 5.3% | 5.7% |
| No. yrs div paid | 24 | 21 | 24 | 24 | 26 | 26 |
Scroll L-R (Data source: SharePad/company accounts. Some adjustments were needed. *Dividend yields were weighted to reflect position size from 2025 onwards. Prior to this they were simply averaged.)
The average market cap of the companies in the portfolio rose once again during the first quarter of this year. I'm happy to see this rising as my aim is to have a mix of smaller, mid-sized and larger companies.
Profitability (ROCE) and valuation (EBIT & FCF yield) both remain at similar levels to the end of last year. In my view, these figures suggest that in aggregate, at least, the companies in my portfolio are good quality businesses at affordable prices. Whether this translates into encouraging future performance remains to be seen, of course. It's also worth remembering that an attractive average can mask some ugly individual values.
I'm more confident with regard to leverage. Twelve of the 19 companies in the portfolio reported net cash positions in their most recent accounts. Of the remaining seven, five are well-established FTSE 100 businesses where I judge that the level of gearing in use can comfortably be managed.
Only two of my leveraged companies are small or mid caps. In my view only one of these carries any real risk in relation to debt. In this case, I expect to see progress on deleveraging during the current year and may decide to sell if this does not happen.
The portfolio's dividend metrics remain attractive and this remains at the core of my strategy. Annual income from the portfolio has risen above inflation every year since inception, despite the lamentable share price performance of some stocks.
Looking at the table above, the increased dividend yield in Q1 versus December 2025 was largely due to share price declines over the last three months. Looking ahead, the portfolio's forecast dividend yield of 5.7% reflects expectations for continued dividend growth this year.
The companies in the portfolio have all paid dividends for at least the last 12 years, although this may have included some cuts. The average is 26 years and some have made consecutive annual payouts for more than 30 years.
This too is a core element of my strategy. In my opinion, a company that has demonstrated a commitment to providing shareholders with a tangible (cash) return on their investment over many years is more likely to have a sustainable long-term strategy than one which doesn't.
While buybacks may be effective in some circumstances, I don't consider them to be a tangible return on investment. As income fund manager Daniel Peris explains, a dividend is a business outcome for owners, while a buyback is a market action that only provides a tangible benefit (if it at all) to sellers of the stock.
Final thoughts
It's been a poor start to the year for my portfolio, made worse by the impact of the Middle East conflict. The situation doesn't seem to be settled at the time of writing and I think it's reasonable to expect further geopolitical disruption to markets this year.
Fortunately, most of the companies in my portfolio still appear to be in good health and performing largely as expected.
For the minority where performance hasn't been satisfactory, I'll be looking to see (expected) improvement this year or else considering a sale.
As always, thank you for reading – and good luck in the markets!
Roland Head
Disclaimer
This is a personal blog/newsletter and I am not a financial adviser. All content is provided for information and educational purposes only. Nothing I say should be interpreted as investing advice or recommendations.
You should carry out your own research and make your own investing decisions. Investors who are not able to do this should seek qualified financial advice. Reasonable efforts are made to ensure that information provided is correct at the time of publication, but no guarantee is implied or provided. Information can change at any time and past articles are not updated.