
Q3 2025 dividend portfolio review: income growth + expensive lessons
A disappointing Q3 and two small-cap losses have prompted me to revisit my approach to position sizing and portfolio structure.


Welcome to my third quarter dividend portfolio review. After a relatively upbeat Q2, I have to report that Q3 was a poor period for the stocks in my model portfolio (and my personal holdings).
Let's start with some good news, though! My primary goals for this portfolio are:
- Provide a dividend yield greater than the FTSE 100;
- Provide inflation-beating income growth.
So far this year, the portfolio has achieved both of these targets, maintaining its track record:
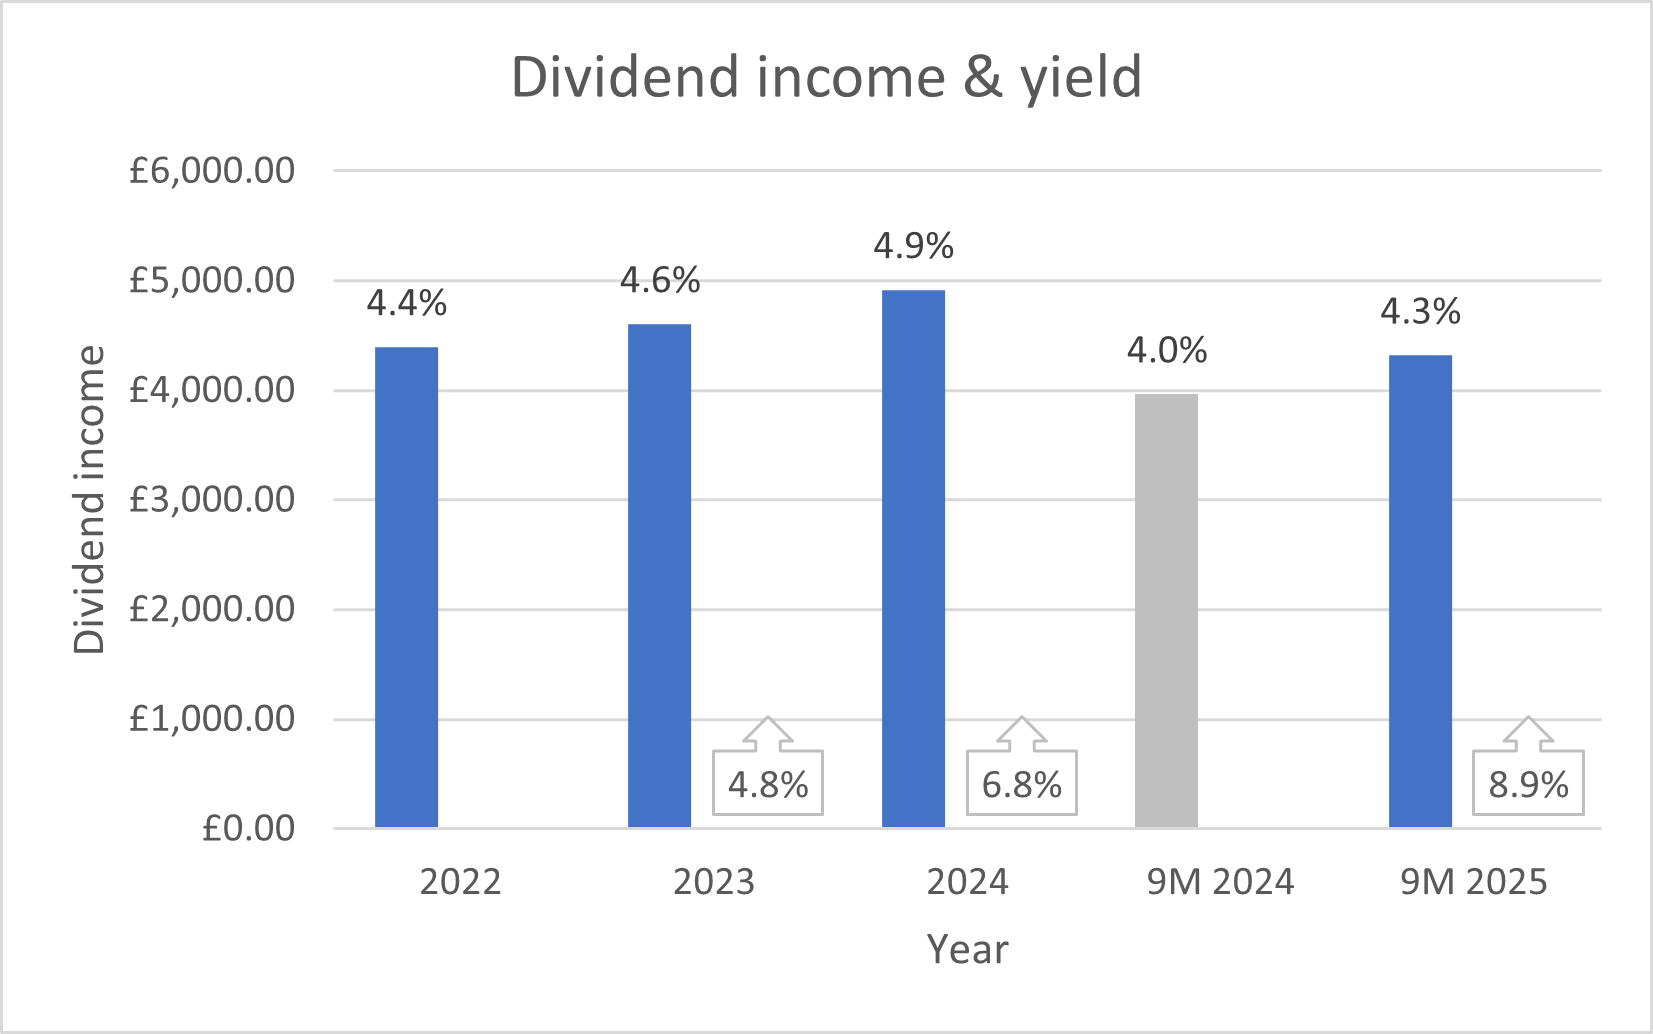
Now for the bad news...
Market movements continued to favour the FTSE 100 in Q3:
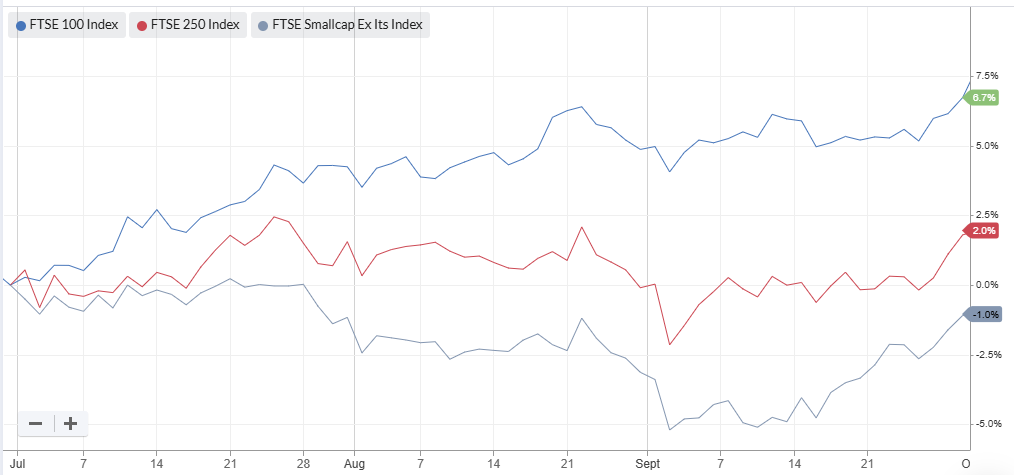
Unfortunately, the portfolio's all-cap mandate and median market cap of c.£850m means that my exposure to these big market movers was limited.
I was also forced to acknowledge some self-inflicted problems during the quarter.
One of my shares fell by 40%, providing me with a costly reminder of the risks of ignoring negative momentum in cyclical businesses.
In addition, I decided to sell my shares in one company after realising that I had misunderstood the exceptional market conditions that existed when I originally invested.
These problems (and others) have compounded the portfolio's long-term underperformance. They've also prompted me to rethink my approach to managing the portfolio.
While my core strategy of looking for good quality dividends will remain unchanged, I am planning some changes to the way I approach position sizing and future trading activity.
In the remainder of this review, I'll take a closer look at the portfolio's performance during Q3, highlight any trades (there was only one, a sale) and explain a little more about the changes I'm going to make. I will also update my record of the portfolio's key financial metrics.
- Q3/9M 2025 performance review
- Portfolio changes in Q3 2025
- Position weightings & upcoming changes
- Key financial metrics for the portfolio
- Final thoughts
Q3 2025 performance review
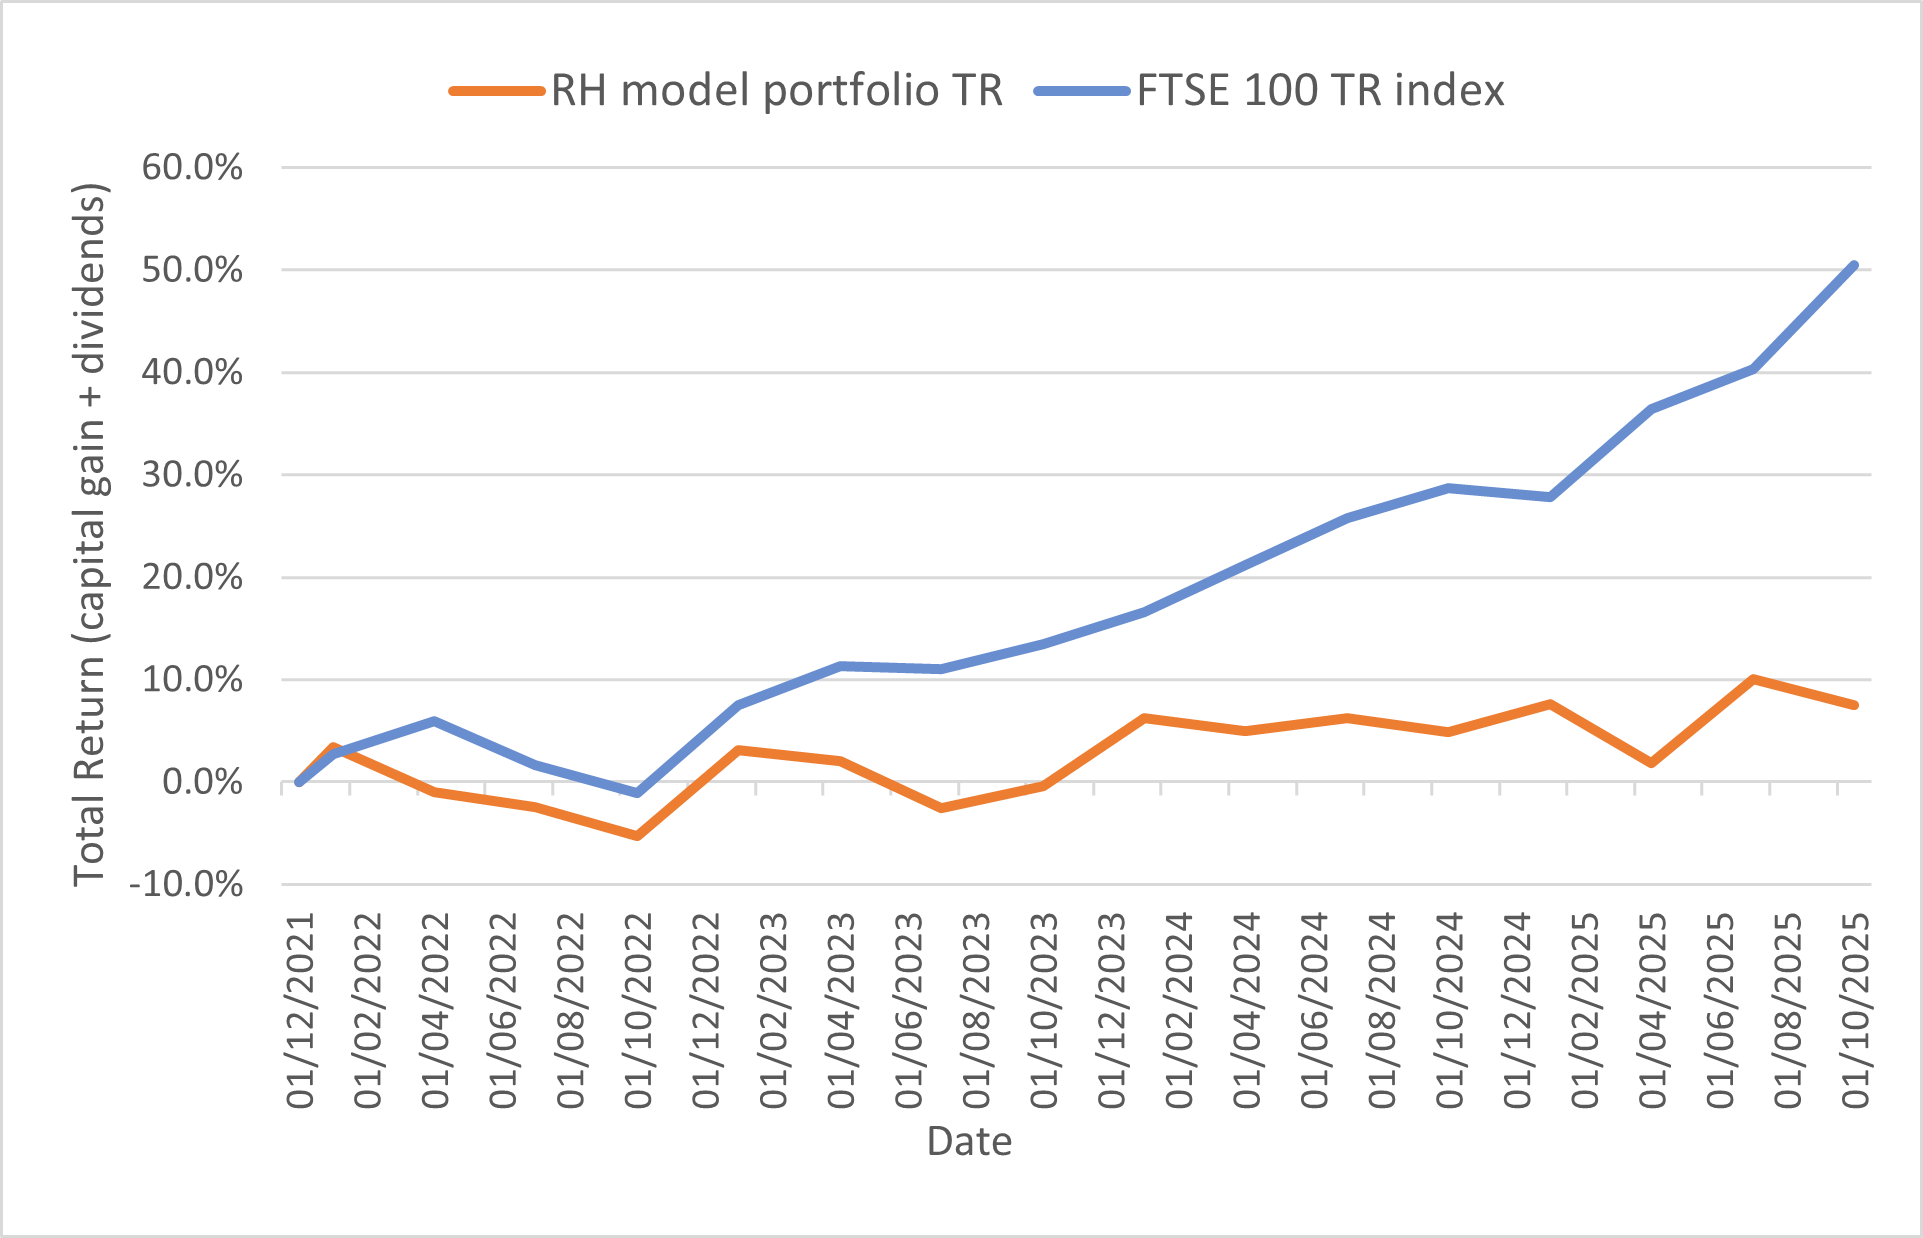
Here's how the portfolio's performance panned out at the end of the quarter, measured on a total return basis (share price movements + dividend income):
Q3 2025 performance:
- RH model portfolio total return: -2.3%
- FTSE 100 Total Return index: 7.2%
9M 2025 performance:
- RH model portfolio total return: 0.0%
- FTSE 100 Total Return index: 17.7%
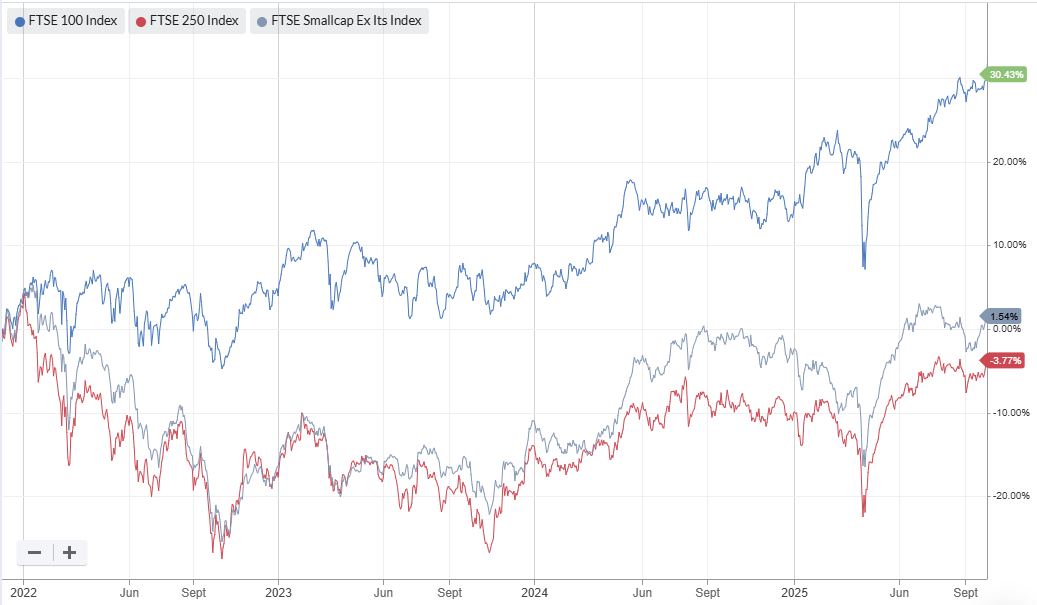
The chart below gives a broader view on the model portfolio's performance since its inception in December 2021. Sadly, the Q2 improvement in performance against the benchmark was not maintained in Q3:
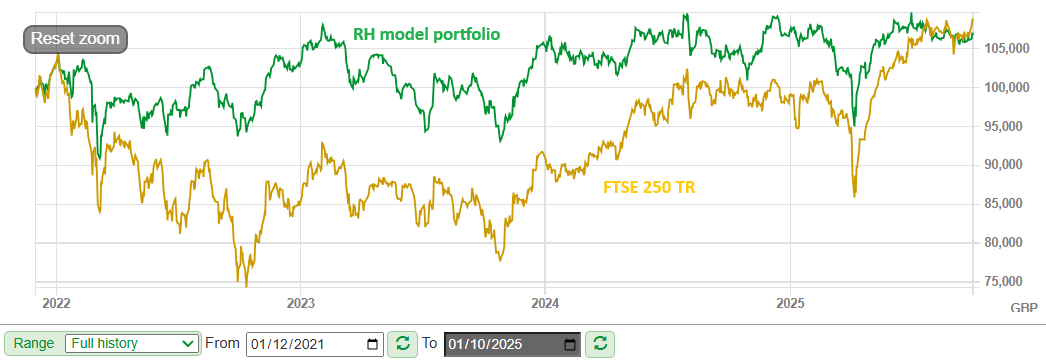
The portfolio's longstanding lead over the FTSE 250 Total Return index is also now at risk:
Looking within the portfolio suggests that Q3 underperformance was primarily due to the absence of big risers during the period, relative to the FTSE 100:
- FTSE 100: nine stocks rose by 20% or more in Q3, with 32 rising by 10% or more
- RH portfolio: 2/20 stocks rose by at least 10%, but none registered gains of more than 15%
Here's a breakdown of movements within the portfolio. The majority of the overall loss was due to the portfolio's biggest faller, "C", which contributed -2% to the portfolio's overall negative performance:
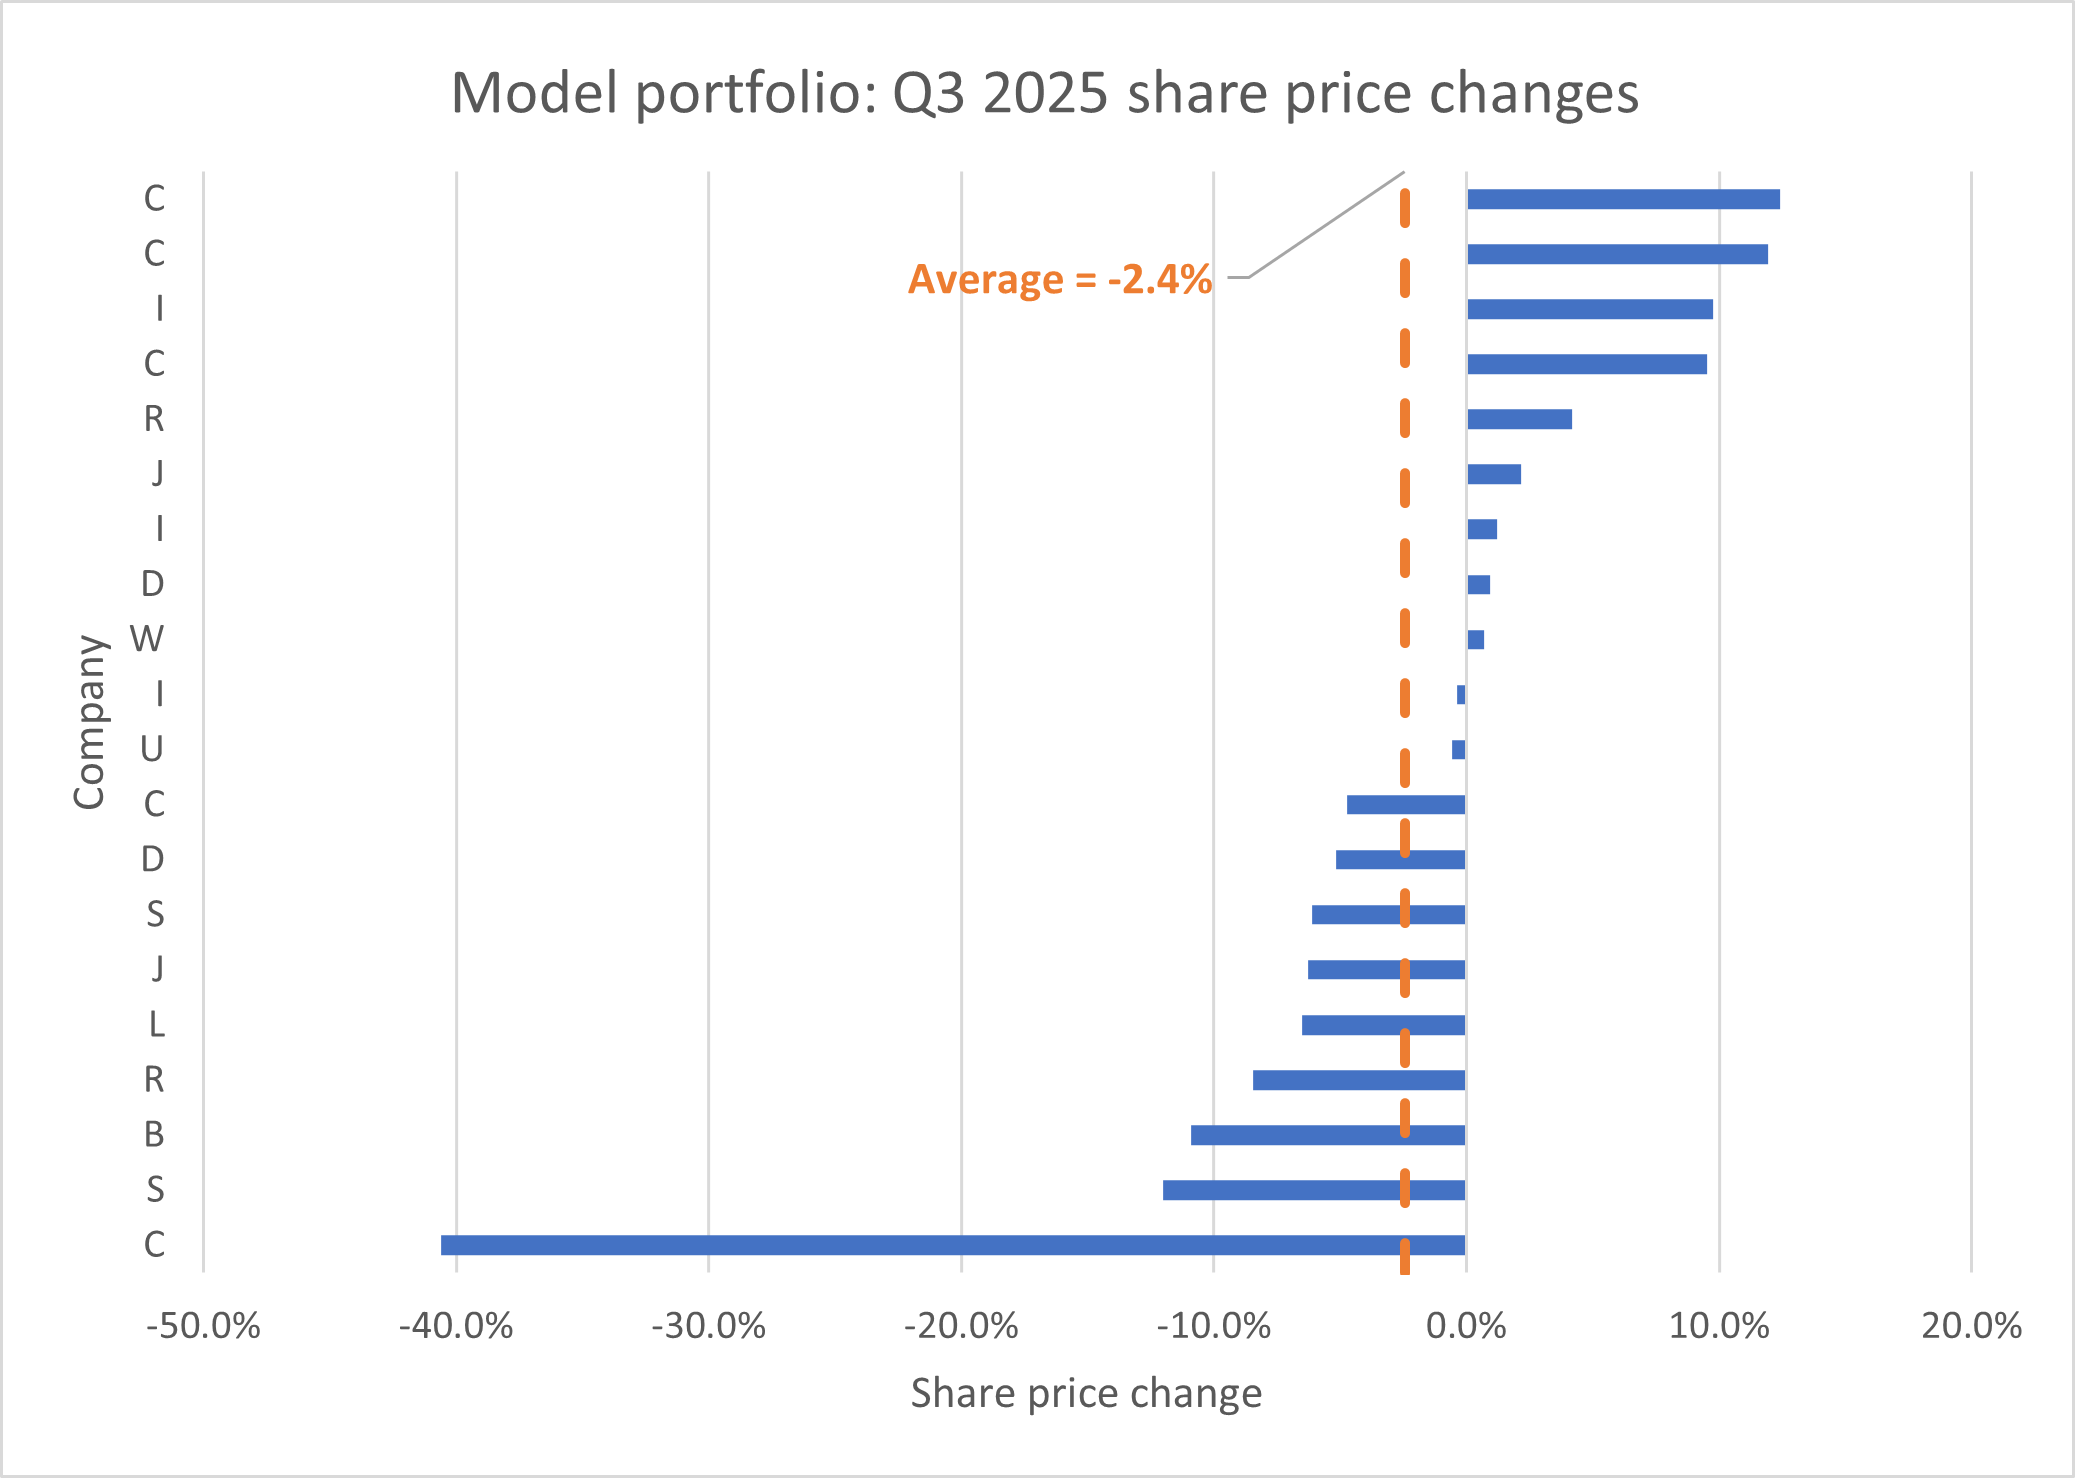
Looking at the rest of the stocks in the portfolio, I don't think there's really much of significance to report. Two of the biggest risers reported positive results during September (covered here), but in general I don't see +/-10% moves as especially significant over a three-month period.
I think the lack of big risers was the main reason for underperformance here – the FTSE 100 also had some losers during the quarter, but these were outweighed by winners. That wasn't the case in my portfolio.
Portfolio changes in Q3 2025
After top-slicing the portfolio's largest position in July (see here), I only made one further changes in Q3, selling the portfolio's entire position in Somero Enterprises (LON:SOM).
Here's an extract from my sale report to subscribers at the end of September:
I now believe my view on Somero's valuation and growth potential was mis-framed when I bought the stock. I didn't recognise the exceptional peak in cyclical earnings, leading me to think the shares were a lot cheaper than they really were.
Conclusion: I think there's a reasonable chance Somero will become a larger but less profitable business in the future. There is perhaps also some prospect of a takeover bid.
I also suspect that there will be be less focus on dividend returns than in the past.
The end result is that I'm left holding a niche US firm facing sector headwinds and growing competition at home and abroad.
In fairness, the new CEO hasn't yet had a chance to prove himself. I could remain patient and hope that current earnings represent a cyclical low.
However, my general policy is to sell a stock when I think the investment case has changed – or when I realise I've misunderstood the investment case. I think both are probably true here.
I sold the model portfolio's position on 9 October 2025 for 235p per share, giving a total return loss of -34.7%, including a +18% contribution from dividends. (See the portfolio page for further details.)
Position weightings
Here's a snapshot of how the model portfolio looked at the end of the quarter (paid subscribers can see this chart with company names on my portfolio page):
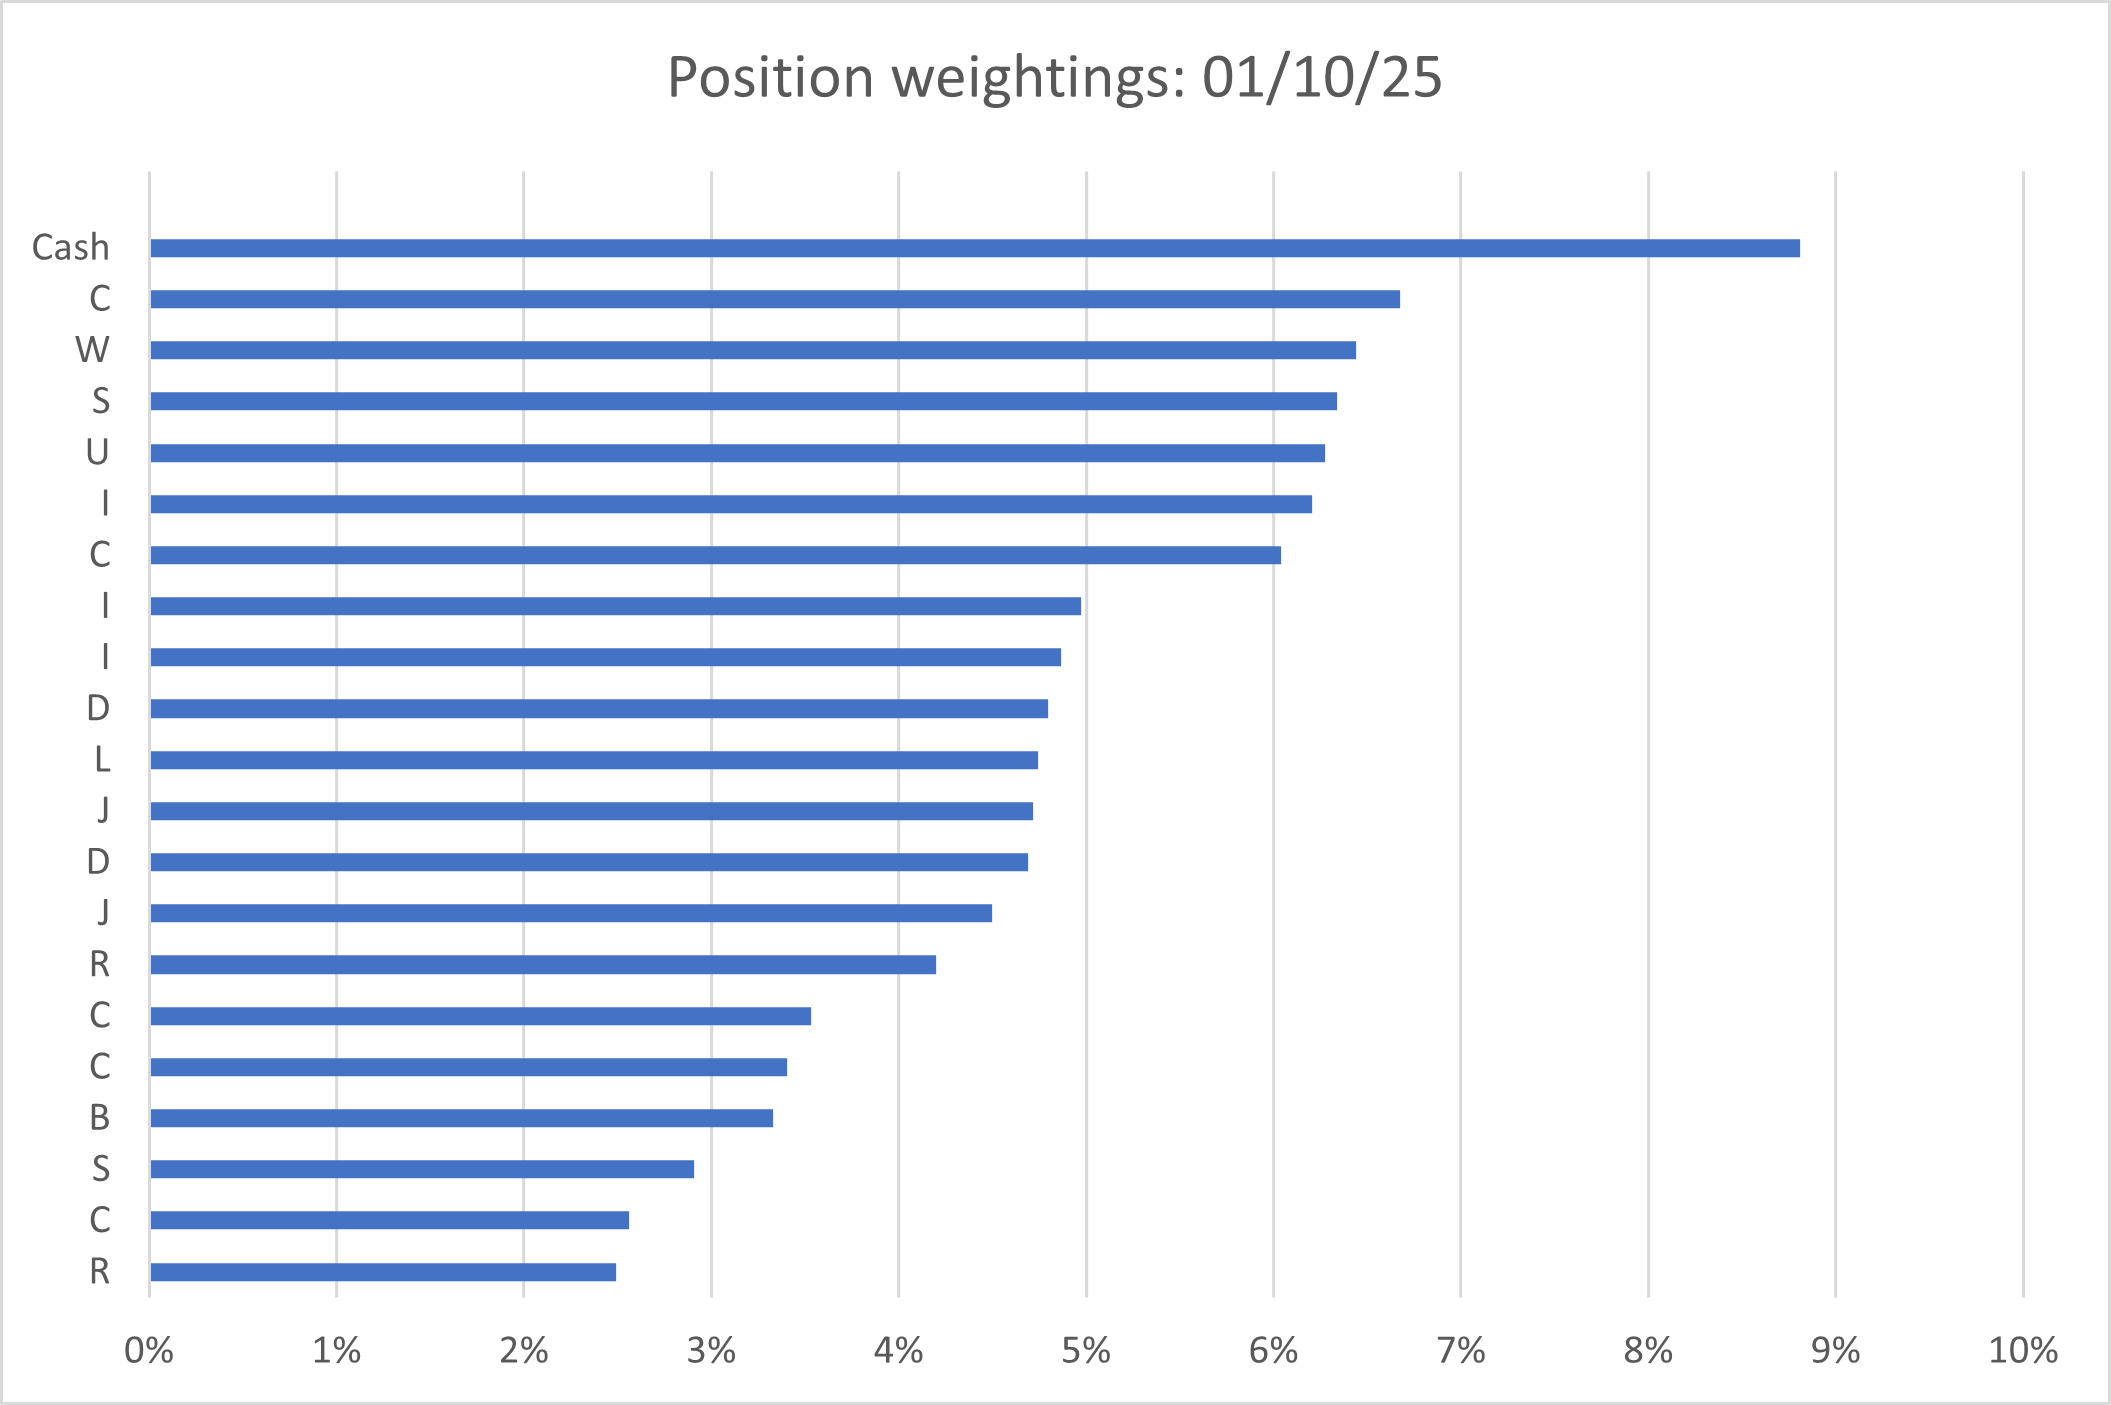
As mentioned above, I sold the <3% position 'S' (Somero Enterprises) earlier in October. This means the portfolio now has 19 stocks – and a 12% cash weighting.
I plan to deploy some of this cash in top ups and a possible new buy over the coming months. But the way I do this may be affected by my changing approach to position sizing and trading.
Position sizing: a new plan
To date, my model portfolio positions have all been initiated with a weighting equivalent to about 4.7% of the original portfolio capital, with a target of 20 positions.
Going forward, I will be changing this approach slightly, as I flagged earlier this month:
My aim will be to try and increase the portfolio's weighting to a group of stable and well-understood core positions, with smaller starting [satellite] positions that either gradually become core or are traded out more readily.
Here is the new framework I'm going to use:
- New positions: 2.5-3.0% initial weighting;
- Entry points: pay greater attention to price and earnings momentum when considering entering a new position;
- Top ups: in 1%-2% increments, when justified by valuation and trading outlook;
- Core: long-term holdings that have likely been accumulated over >1yr and which I intend to hold indefinitely;
- Satellite: new holdings which may be either potential future core holdings or more cyclical/value income stocks to be held for 1-3 years and then sold, hopefully delivering capital gains alongside income;
- Portfolio size: this sounds counterintuitive in terms of reducing risk, but I may allow the portfolio to become slightly more concentrated (i.e. fewer positions).
The underlying reason for these changes is that most of the portfolio's largest losses to date have come because I have entered a new position at the wrong time, in the face of negative momentum. As a result, I have quickly suffered large share price losses.
As the saying goes, you make your money when you buy.
My hope is that I can improve outcomes by considering my entry points more carefully. Rather than looking at valuation in isolation, I aim to pay greater attention to the trading outlook and to technical factors affecting the price.
In addition, by opening positions with a lower weighting, I hope to be able to exit with smaller losses when things don't go to plan:
- A 40% loss on a 4.7% position is 1.9% of the portfolio;
- A 40% loss on a 2.5% position is 1% of the portfolio.
Portfolio: key financial metrics
In the final section of each quarterly review I take a look at the portfolio as if it was a single stock. I think it's useful to view the portfolio in this way to ensure that it still has the aggregate characteristics I'm looking for, such as strong profitability and good cash generation.
Of course, averages can mask a multitude of company-specific issues. This approach will not protect against that, but I still think it's a useful way to track broad changes in the quality and valuation of the portfolio over time.
Here's how the model portfolio looked at the end of September 2025:
| Date |
Median mkt cap |
TTM ROCE | TTM EBIT yield |
TTM FCF yield |
Net debt/5yr avg net profit |
TTM div yield* |
5yr avg div grth |
fc div yield* |
No. yrs div paid |
| 30 Sep 25 | £847m | 21.2% | 10.3% | 7.1% | -0.2x | 5.3% | 5.3% | 5.0% | 25 |
| 31 Dec 24 | £983m | 22.5% | 11.0% | 8.0% | -0.3x | 5.4% | 6.3% | 5.4% | 24 |
| 31 Dec 23 | £1,700m | 21.0% | 11.3% | 7.1% | 0.2x | 5.3% | 6.3% | 5.2% | 24 |
| 31 Dec 22 | £2,300m | 22.2% | 9.4% | 7.0% | 0.3x | 4.5% | 7.6% | 5.0% | 21 |
| 31 Dec 21 | £3,200m | 20.6% | 8.7% | 6.7% | -0.2x | 4.1% | 8.3% | 4.4% | 24 |
Scroll L-R (Data source: SharePad/author analysis. Some adjustments were needed. *Dividend yields were weighted to reflect position size from 2025 onwards. Prior to this they were simply averaged.)
Looking at the table, what strikes me is the general lack of change since the portfolio's inception. The one exception to this is the median market cap of the stocks in the portfolio, which has fallen by over 70%.
When I compare the size of the companies in the portfolio at its inception with the picture at the end of September, the explanation becomes clear:
| # Holdings | Dec 2021 | Oct 2025 |
| Market cap >£5bn | 8 | 5 |
| Market cap £1-5bn | 3 | 5 |
| Market cap £500m-1bn | 2 | 1 |
| Market cap <£500m | 7 | 9 |
I don't have a strong view on the ideal mix of market caps, but my instinct is that it might be useful to increase the weighting to larger companies slightly.
Final thoughts
There's no escaping the reality that the portfolio has performed poorly since its inception. While it's true that the UK's small and mid-cap indices have also underperformed the FTSE 100 since 2022, I think this is only a partial excuse:
The main point of a stock-picking portfolio is to outperform the wider market. While December 2021 appears to have been a poor time to launch an all-cap portfolio, plenty of other stock-picking strategies have performed much better over this period.
With one or two exceptions, I'm still happy with the valuation and quality of the stocks I own. Indeed, in a number of cases I think they've improved since my original purchase.
Clearly, this hasn't always been reflected in share price performance – at least, not yet.
Looking ahead, I'm cautiously optimistic that my new approach to position sizing and trading may to control the size of any further losses, while allowing me to build larger core positions.
In Q4 the model portfolio will also receive shares in an upcoming spinout from an existing holding. The nature of the situation means I'll either have to sell the spinoff shares or buy more of them to form a suitably-sized position. I plan to make a decision when the prospectus is published next month, so I'm keeping an open mind for now.
However, at this stage I think it's more likely that I'll allocate cash either to existing positions or to a replacement 20th stock sourced from among the results of my stock screen.
I plan to publish more on this in the coming weeks for subscribers, together with details of any top-ups I decide to make.
Roland Head
Disclaimer
This is a personal blog/newsletter and I am not a financial adviser. All content is provided for information and educational purposes only. Nothing I say should be interpreted as investing advice or recommendations.
You should carry out your own research and make your own investing decisions. Investors who are not able to do this should seek qualified financial advice. Reasonable efforts are made to ensure that information provided is correct at the time of publication, but no guarantee is implied or provided. Information can change at any time and past articles are not updated.