
Q1 2024 quality dividend portfolio review: income growth

I ended last year on an optimistic note about the outlook for UK equities in 2024.
So far this year, the reality has been more nuanced. At least, it has been for my model dividend portfolio.
Although the results from my portfolio companies have mostly been in line with expectations, two new problems did emerge, prompting sharp share price drops.
Fortunately the picture has been much stronger in terms of dividend income. Cash payouts from the companies in the model portfolio rose by 26% during the first quarter, compared to the same period last year.
My portfolio stocks continue to offer an average forecast dividend yield of more than 5% – comfortably ahead of the FTSE 100 average of 3.8%.
While don't expect the rate of growth seen during the first quarter to be extended to the whole year, I am reasonably confident that the income generated by the portfolio should increase this year.
- Q1 2024 portfolio performance
- Dividend income: rising payouts
- Portfolio changes
- Position weightings
- Portfolio: key financial metrics
- Final thoughts
Q1 2024 portfolio performance
The portfolio I'm discussing here is my quality dividend model portfolio, which is run using my dividend screening system.
This model portfolio was launched on 1 December 2021. It contains largely the same shares as my personal portfolio, which has been run on a similar basis for a number of years.
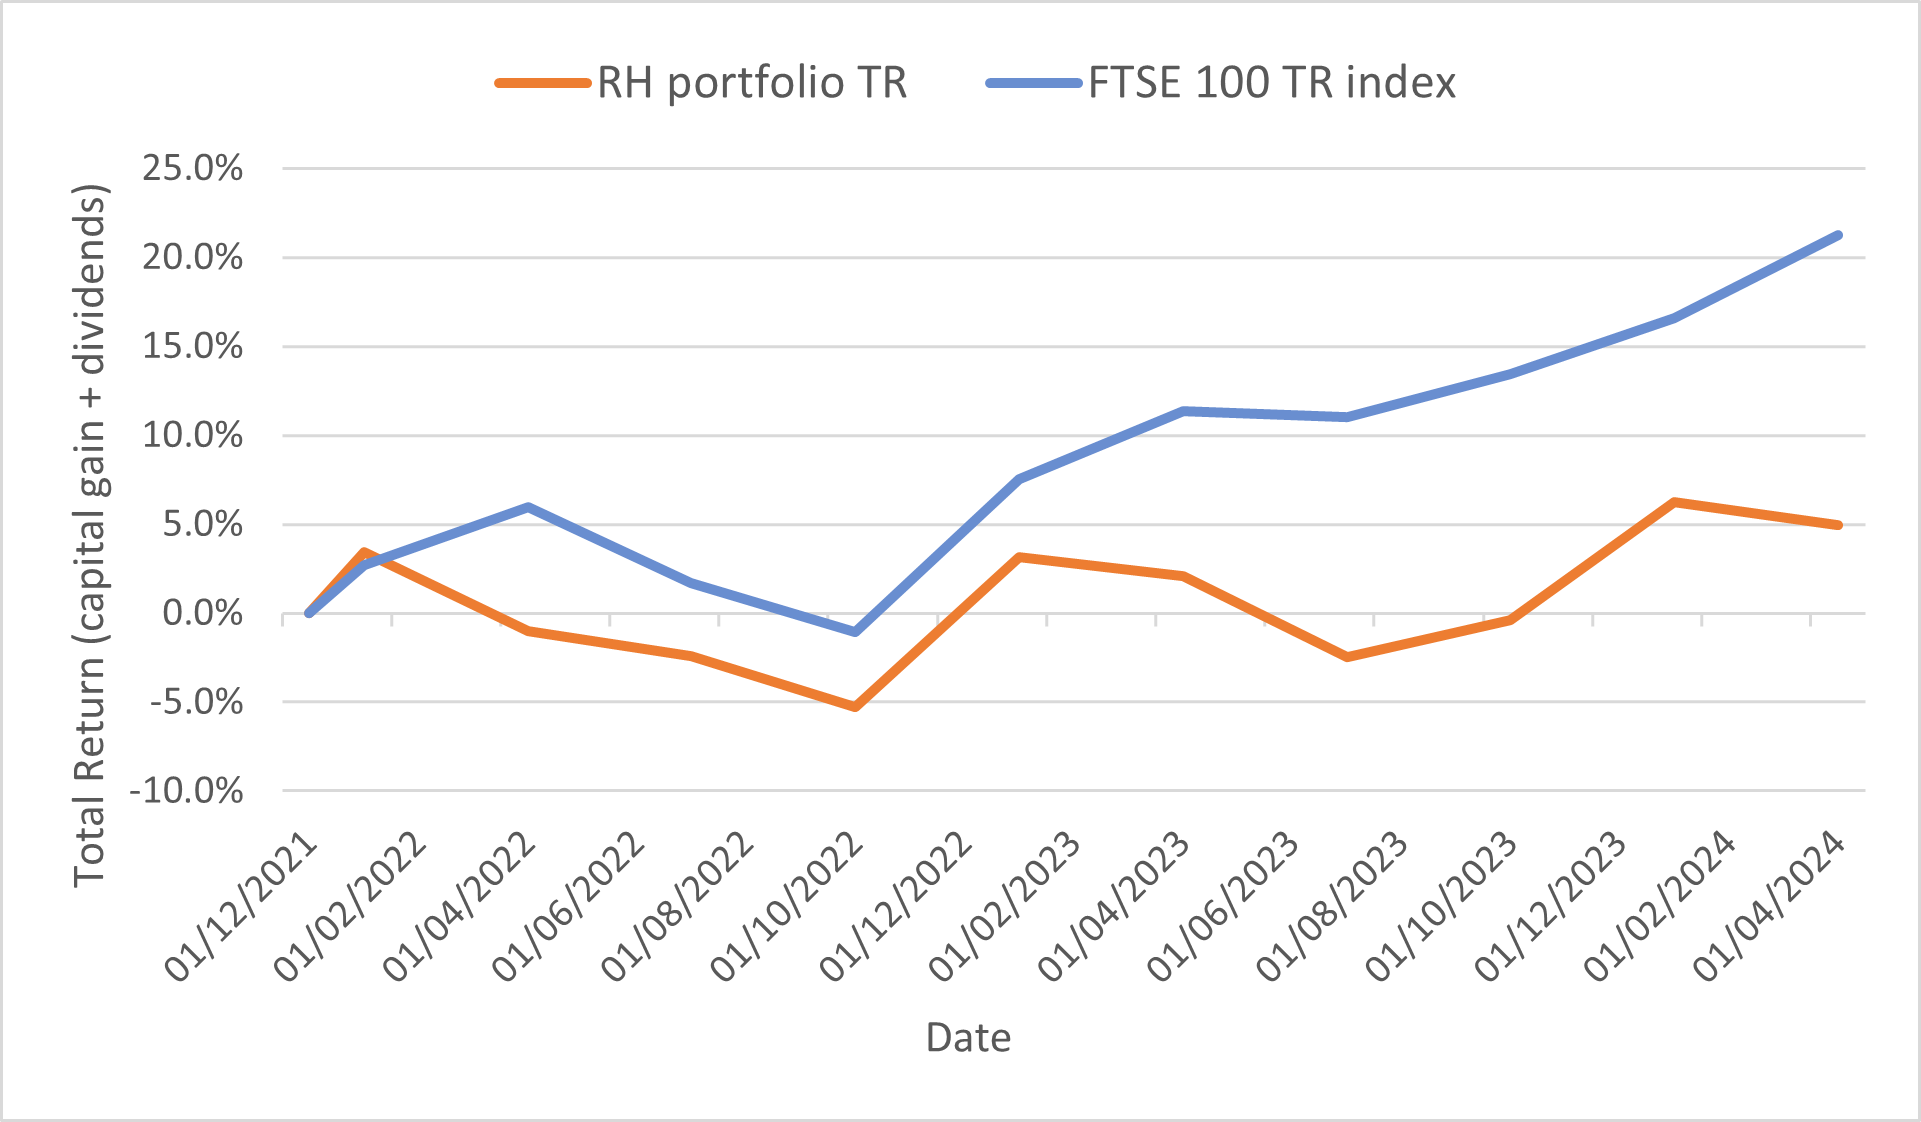
Although this is a dividend portfolio, no income is withdrawn and all dividends are reinvested. For this reason, my main metric for measuring progress against the wider market is total return (share price change + dividends).
Q1 '24 performance:
- RH model portfolio total return: -1.2%
- FTSE 100 Total Return index: +4%
This chart shows the performance of the portfolio against the FTSE 100 Total Return index since the model portfolio's inception on 1 December 2021:
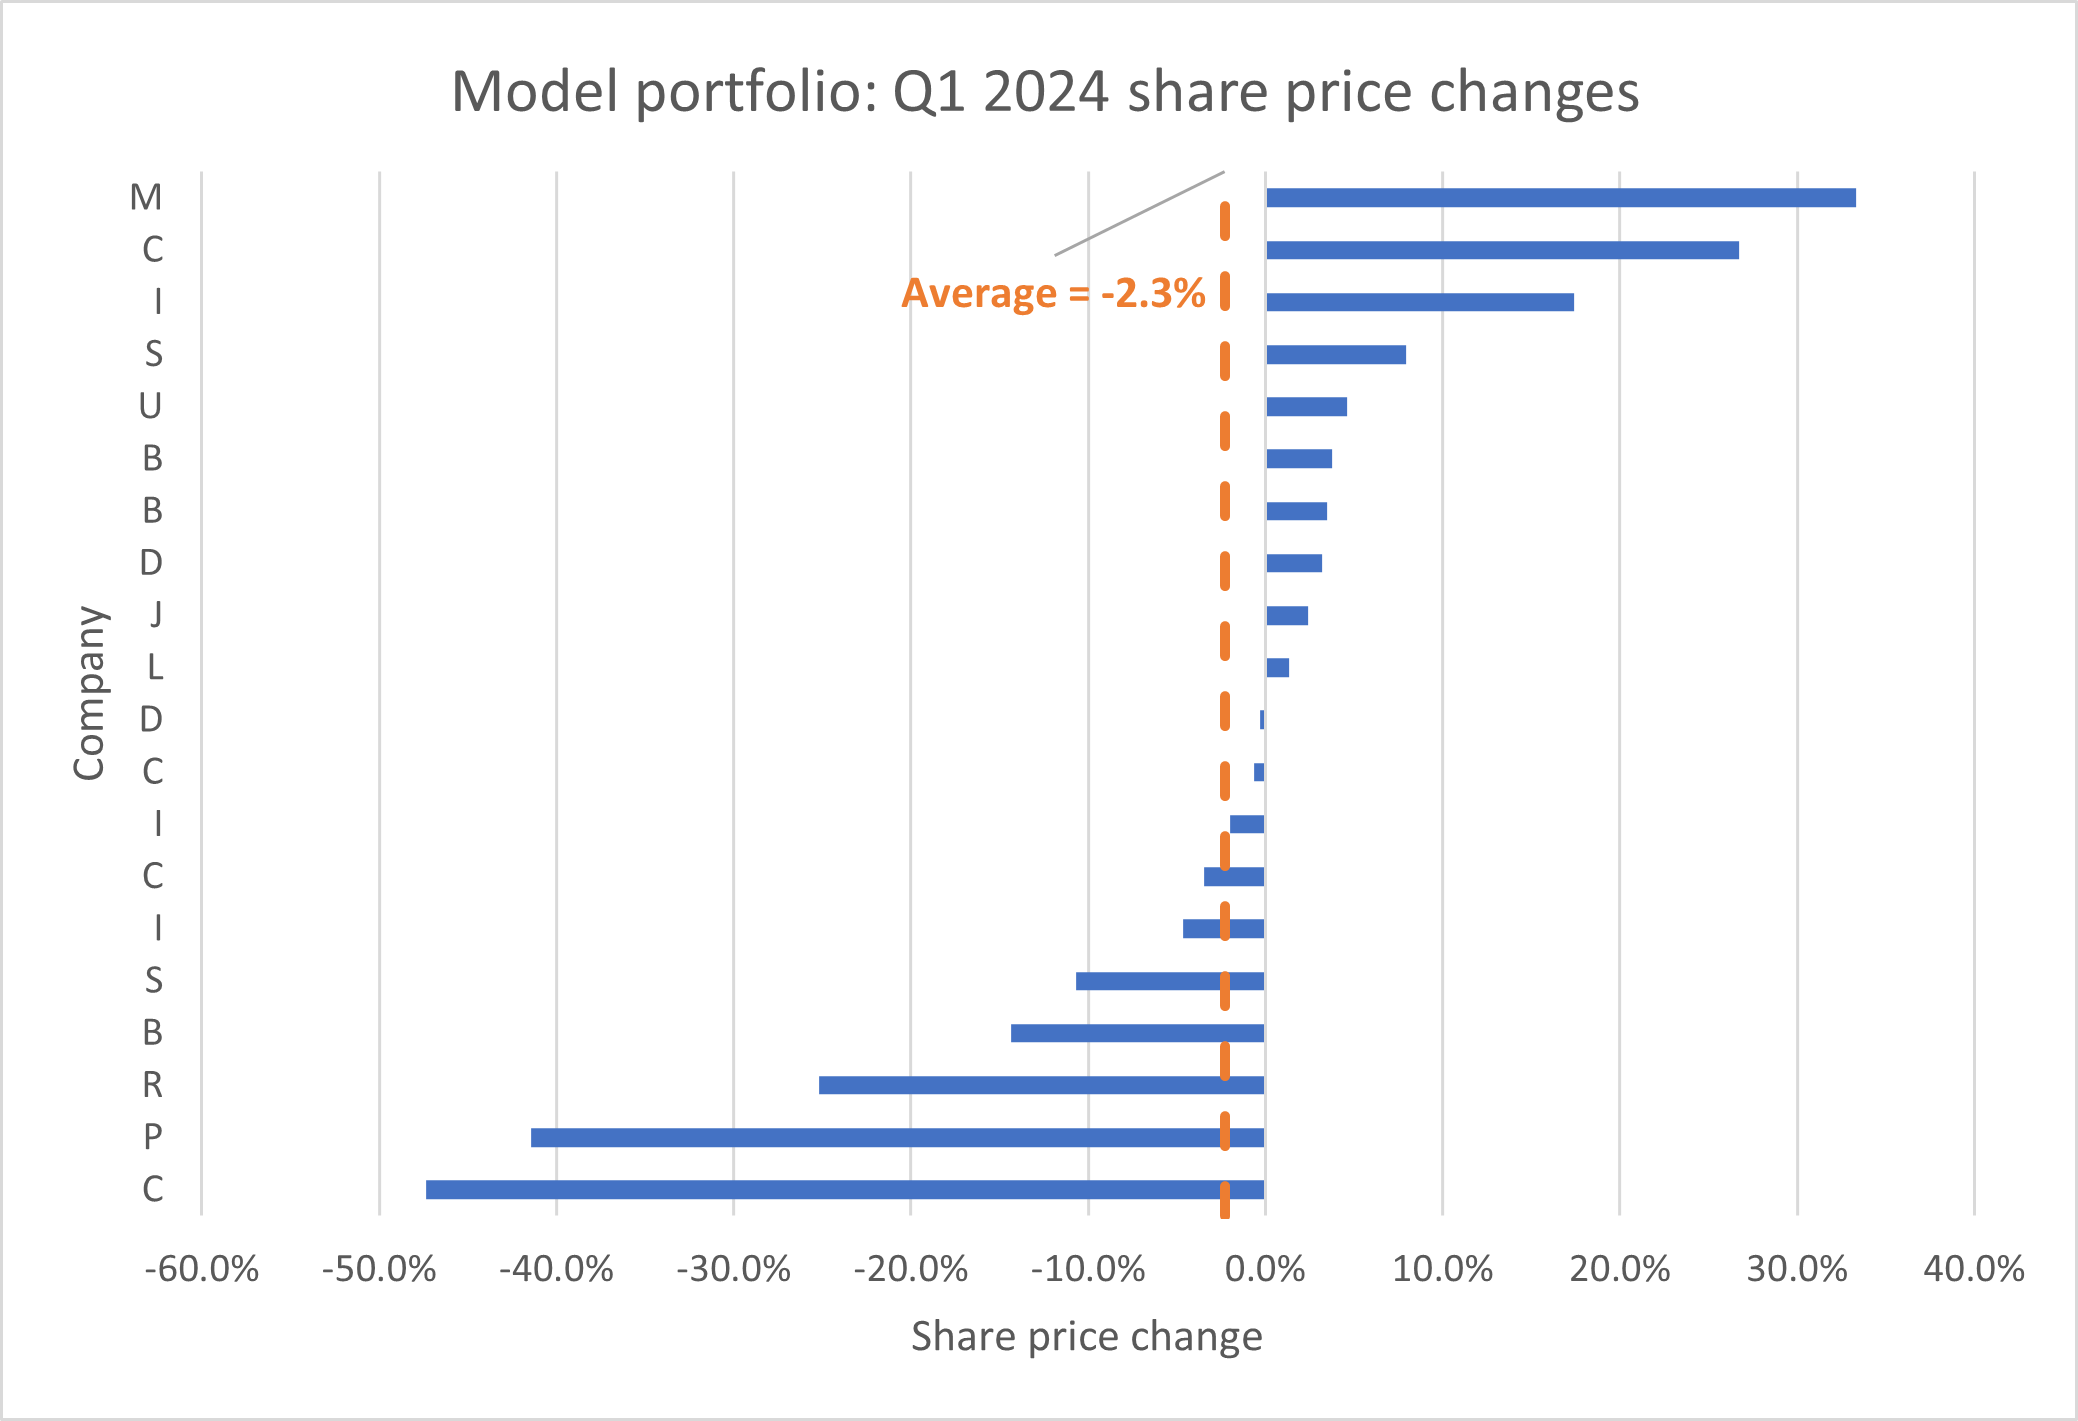
The portfolio's slight loss in Q1 was largely the result of sharp falls suffered by two of the portfolio's FTSE 250 companies. These cancelled out more positive performances elsewhere, leading to an average share price fall of 2.3%:
I think this chart is also a useful reminder of the volatility that's normal in equities. Movements of up to 20% or so are not uncommon and do not necessarily signify all that much.
After all, a majority of the companies in the portfolio reported trading results in line with expectations during the quarter – or did not report at all.
Dividend income: rising payouts
For me, one attraction of dividend investing is the greater stability of returns provided by this approach. Especially as these returns take the form of real cash receipts in my share dealing accounts.
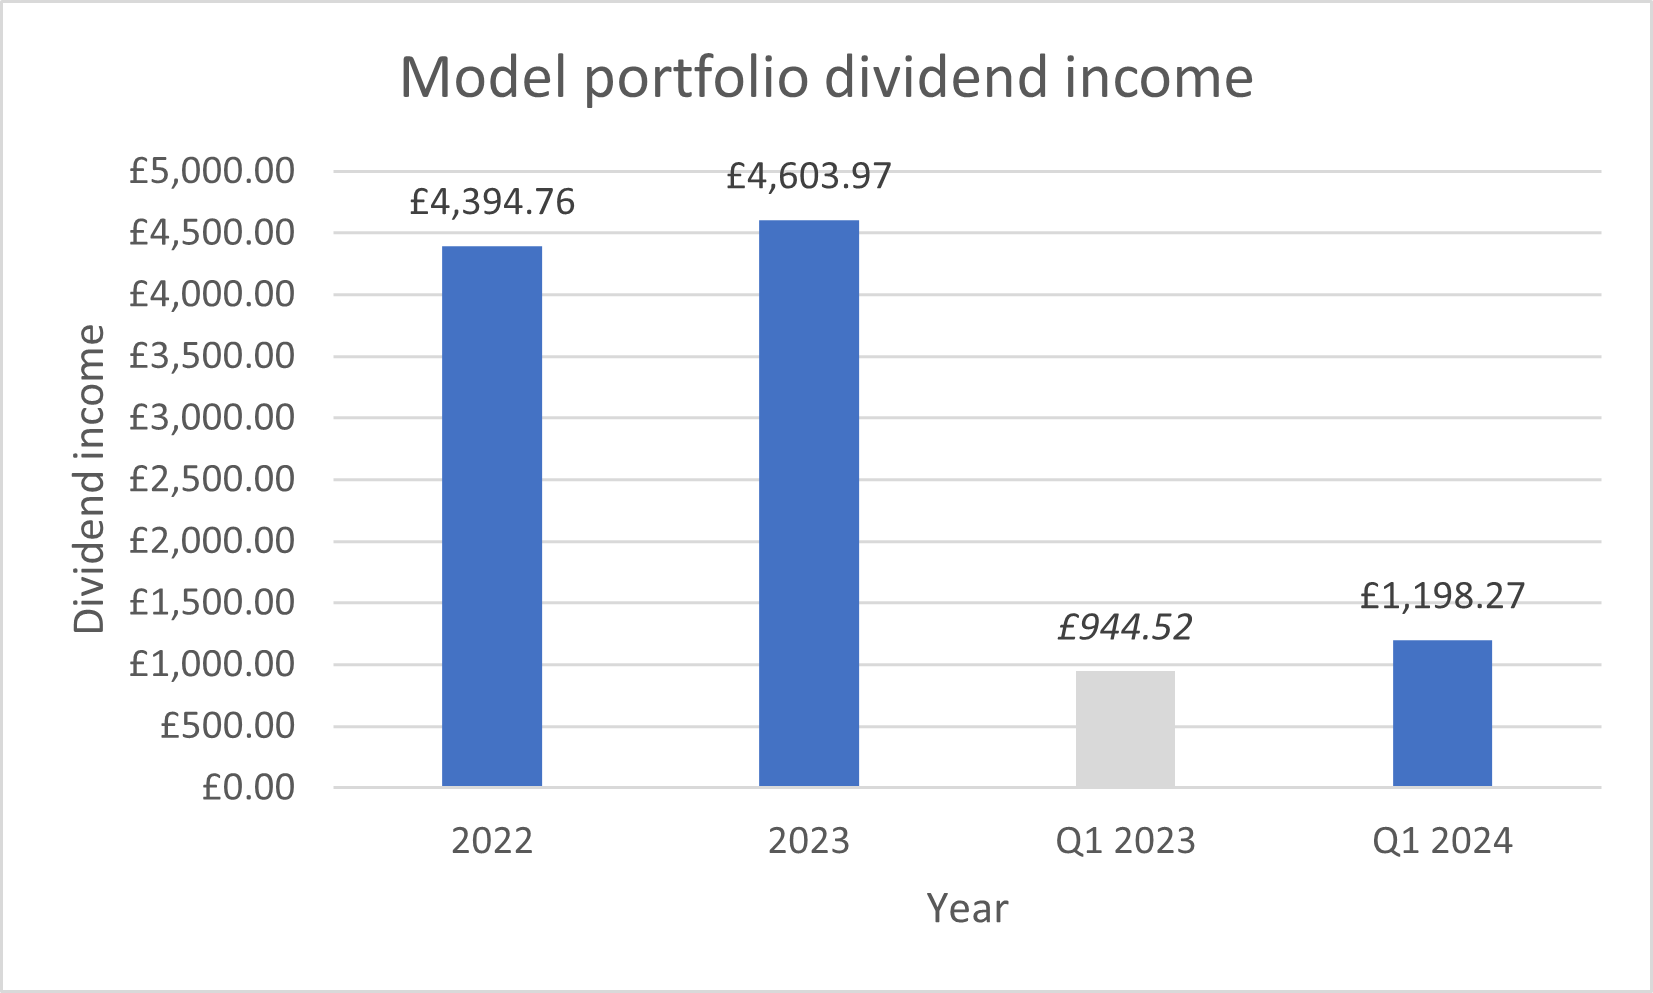
Despite the wide range of share price movements shown above, the total income received from the portfolio remained stable and is currently on track to surpass last year's dividend income (although it's too soon to be sure).
Dividend payouts received in the model portfolio during the first quarter totalled almost £1,200, a 26% increase on the same period last year:
Portfolio changes in Q1 2024
My slow trading policy allows me to make up to two changes to the model dividend portfolio at the end of each quarter.
So far this year, I have sold one share and bought a replacement stock. I did not top up any positions in Q1.
Stocks sold in Q1
March 2024: I sold the model portfolio's holding in Close Brothers Group (LON:CBG) following the company's decision to suspend its dividend for (at least) its current financial year.
Close's board has suspended the payout in order to help build a target war chest of £400m. This will be used if needed to address the "potential financial impact" of the FCA's investigation into historic motor finance commission payments.
Motor finance is a big part of Close's loan book and the company has recently confirmed that it does have historic exposure to the type of product being investigated by the FCA.
This sale resulted in a total loss of 47%. I estimate it had a -2.4% impact on the total return from the portfolio during the quarter. That's a relatively big hit in a 20-stock portfolio.
New stocks in Q1
March 2024: I added a new share to the portfolio to replace Close Brothers.
Both trades were made on 28 March 2024, the final trading day in the quarter.
Position weightings
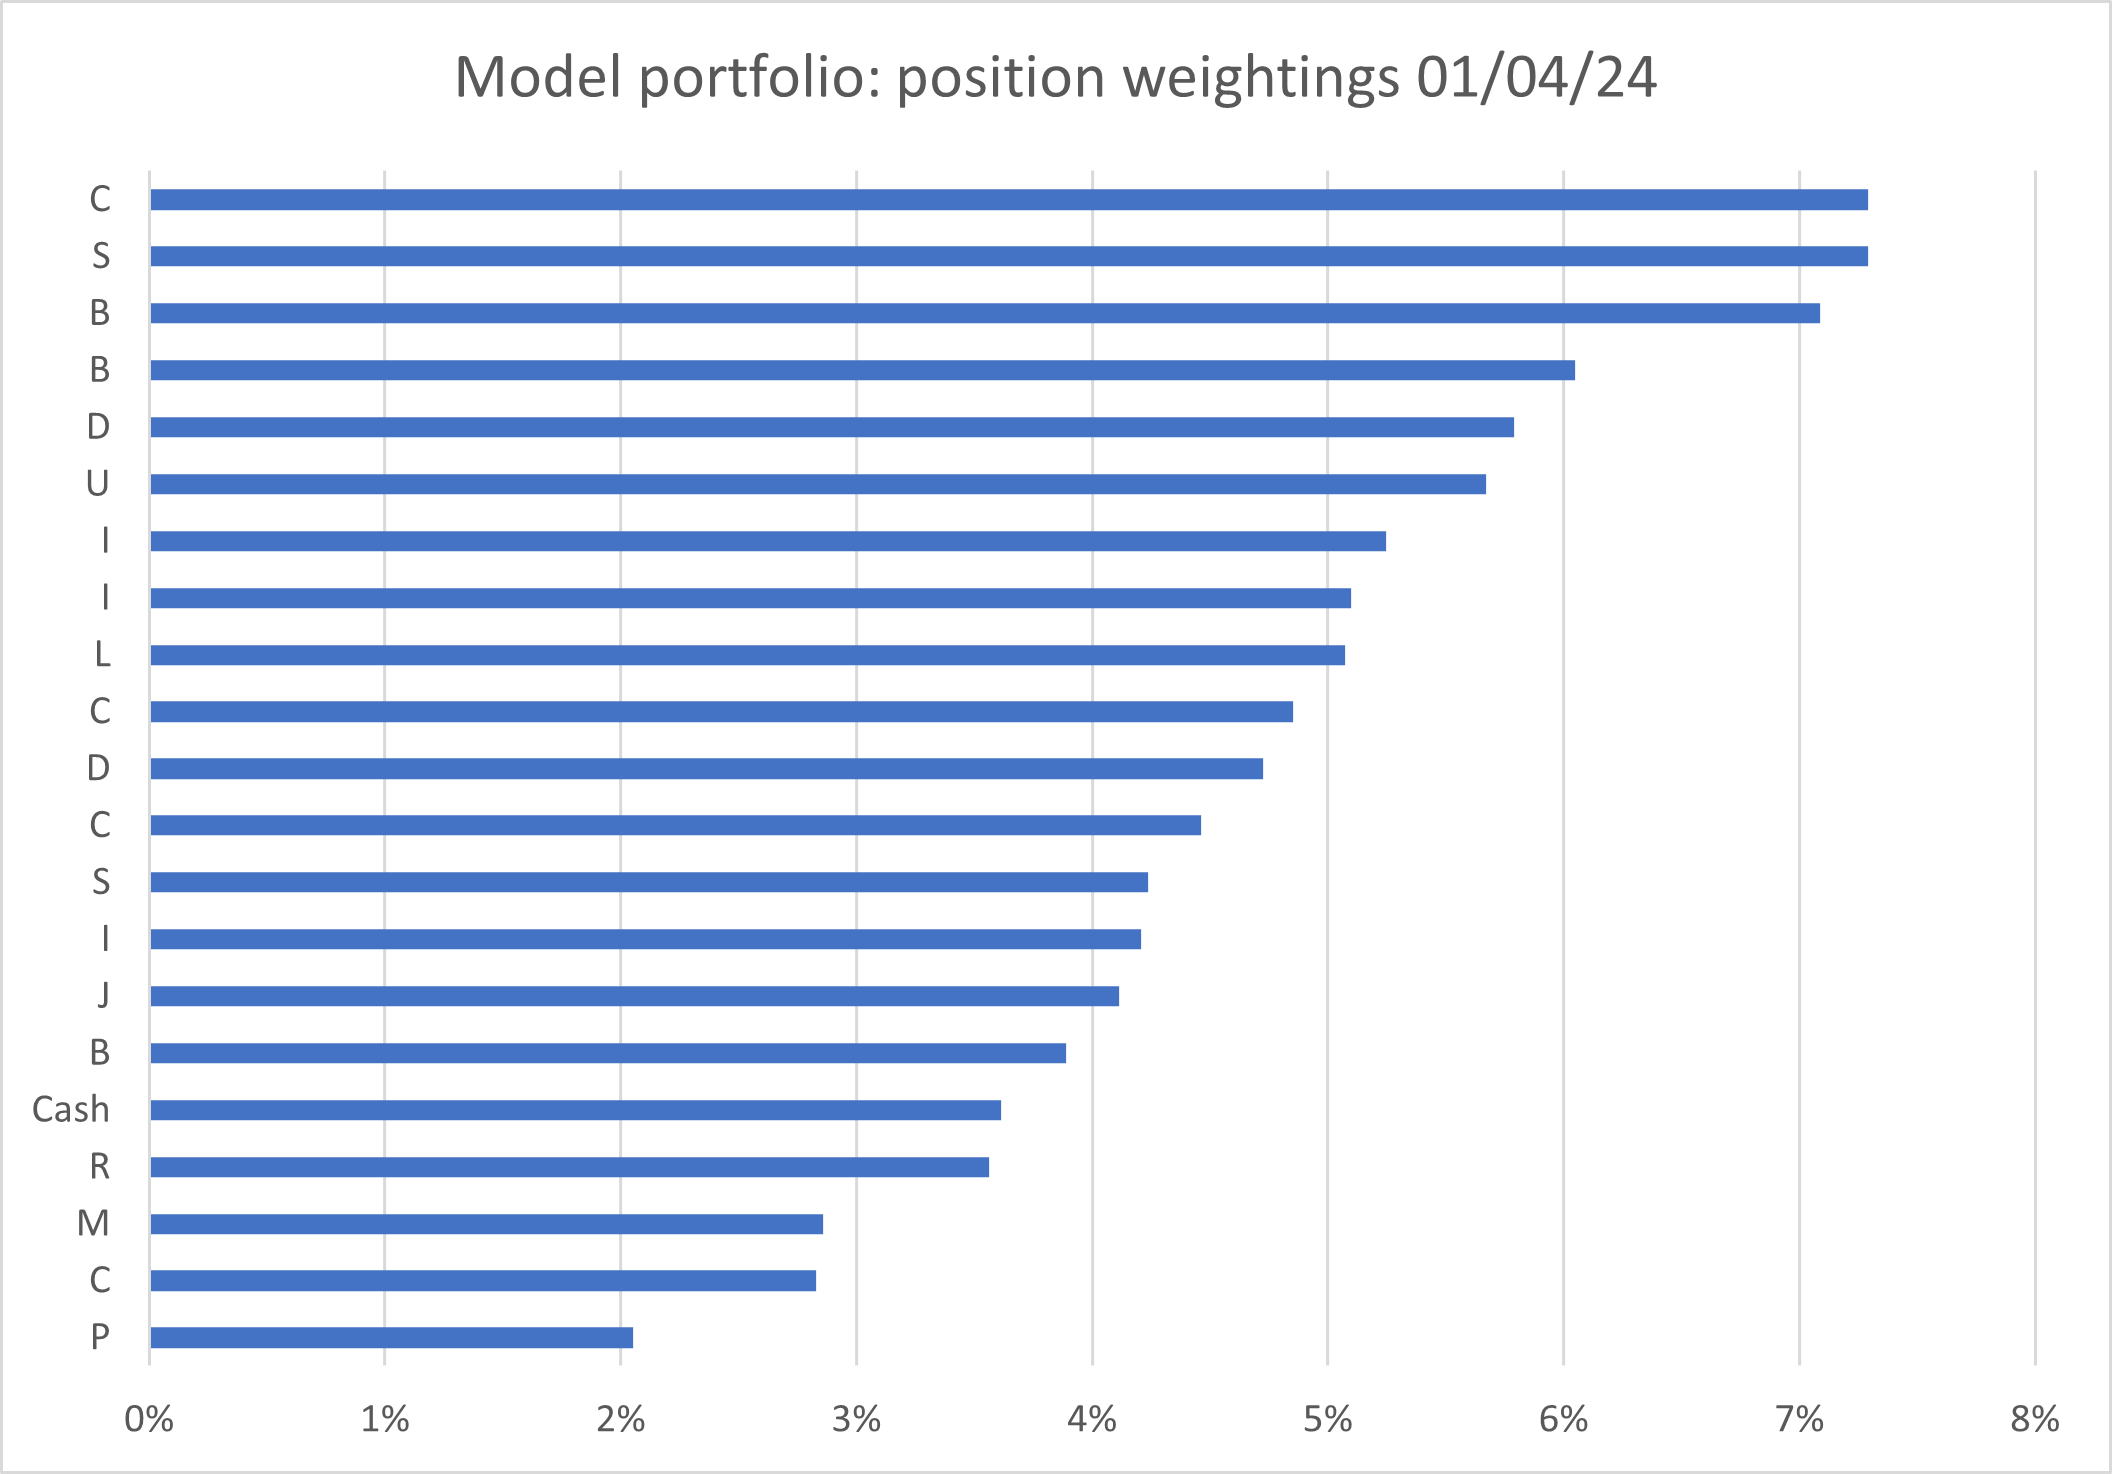
I don't currently have a maximum limit on position weighting in the portfolio, but this is something I may review as the portfolio continues to evolve.
Here's how the model portfolio looked at the end of the first quarter of 2024, following last year's share price movements and the transactions listed above. Subscribers can see this chart with ticker codes included on my portfolio page:
Model dividend portfolio: key financial metrics
I find researching and investing in individual shares to be fascinating and it can certainly be very rewarding.
But for an investor like me whose main aim is to generate market-beating returns, the only test that really matters is the performance of the portfolio as a whole.
With this in mind, I like to monitor the average financial profile of my portfolio, as if it was a single business. While individual companies may have strengths and weaknesses, my aim is for my portfolio to approximate the ideal business – highly profitable, cash generative, and with a strong balance sheet.
As I'm still in accumulation mode, paying in regularly to my real-world portfolio, I'd also like my shares to look be affordably valued.
Here's how the model portfolio looked at the end of March 2024:
| Median mkt cap |
TTM ROCE | TTM EBIT yield |
TTM FCF yield |
Net debt/5yr avg net profit |
TTM div yield |
5yr avg div grth |
F'cast div yield |
No. yrs div paid |
| £2.5bn | 20.9% | 10.0% | 8.0% | -0.1x | 5.2% | 6.7% | 5.1% | 24 |
Scroll L-R (Data source: SharePad/author analysis 04/04/2024. Some adjustments were needed; please don't take this as gospel.)
Here's how these statistics looked at the end of 2023.
What can I learn from these numbers?
The biggest change is that the median market cap has risen from £1.7bn to £2.5bn since the end of last year. Five of the portfolio's six top risers during Q1 were mid-large cap stocks, which I think explains this shift.
With the exception of market cap, the metrics in the table above have not changed very much since the end of last year.
Average return on capital employed (ROCE) is almost unchanged at 20.9% (2023: 21%).
The portfolio also continues to have a broadly neutral net cash/debt position. Broadly speaking, most of the smaller companies in the portfolio have net cash, while a fewer of the larger ones carry some debt and more substantial lease liabilities.
Although 13 out of 20 companies in the portfolio issued interim or full-year results during the quarter, the portfolio's trailing 12-month EBIT and free cash flow yields are within c.1% of those I reported at the end of 2023.
This suggests to me that in aggregate, the portfolio's valuation hasn't changed much in relation to the profitability and cash generation of my companies.
All else being equal, I see a free cash flow yield of 8% as very attractive indeed.
While the portfolio's five-year average dividend growth rate of 6.7% is higher than at the end of 2023 (6.3%), the forecast yield of 5.1% is slightly lower than the trailing dividend yield of 5.2%.
If an individual stock's forecast yield is lower than its trailing yield, the implication is that dividend payouts are going to fall this year.
In the case of the model portfolio, I think the main reason for the lower forecast yield is the sale of Close Brothers. Prior to the suspension of its payout, this financial group had a higher dividend yield than the stock I've replaced it with.
Despite this, I'm still hopeful that actual income received from the portfolio will increase in 2024, after the strong start to the year I discussed earlier.
Final thoughts
It's been a mixed start to the year. The benefit of rising dividend income has to been offset by a big capital loss on the sale of the portfolio's holding in Close Brothers.
More broadly, I am slightly frustrated by the portfolio's continued underperformance relative to the wider market. A look at the performance of companies in the main indices explains why this has happened.
Over the last 12 months, 28 FTSE 100 stocks have risen by 20% or more. Of these, only two are in my portfolio. Unfortunately, I do own one of the top five fallers in this period – stocks down by at least 30%.
In the FTSE 250, 70 shares have risen by at least 20% over the last year, but I only own three of them. Sadly however, my portfolio did contain two of the top 15 FTSE 250 fallers of the last 12 months – Close Brothers and one other.
Periods of underperformance are inevitable with any strategy and all equity investments carry risk. These are real businesses operating in the real world. Progress isn't delivered in a straight line and problems will sometimes occur.
Short-term market movements can also be driven by momentum and sentiment.
While I have some localised concerns about some of the companies in my portfolio, I remain confident that they have solid financial foundations and the capacity to deliver attractive returns.
I also believe there's plenty of value across the portfolio, given the average free cash flow yield of 8%. If valuations remain at current levels, I plan to use accumulated dividend income to top up selected holdings over the course of this year.
Roland Head
Disclaimer
This is a personal blog/newsletter and I am not a financial adviser. All content is provided for information and educational purposes only. Nothing I say should be interpreted as investing advice or recommendations.
You should carry out your own research and make your own investing decisions. Investors who are not able to do this should seek qualified financial advice. Reasonable efforts are made to ensure that information provided is correct at the time of publication, but no guarantee is implied or provided. Information can change at any time and past articles are not updated.


Member discussion