
Quality dividend portfolio: 2023 review
My model dividend portfolio delivered 5% dividend growth in 2023 and offers a forecast yield of 5.2% for the year ahead.


A belated Happy New Year – and welcome back to my latest portfolio review, which will look at the performance of my model dividend portfolio in 2023.
This update will focus on the portfolio as a whole, along with changes made to the portfolio during the year. I cover individual company results in my more detailed monthly reviews for subscribers.
2023 was a relatively active period for the portfolio, with three sales and three new additions. One of these was forced on me through a takeover, the other two were voluntary changes, which I discuss below.
In addition to this, I used the portfolio's accumulated dividend income to top 10 portfolio holdings at various points in the year.
2023 model portfolio performance
The portfolio I'm discussing here is my quality dividend model portfolio, which is run using my dividend screening system.
This model portfolio was launched on 1 December 2021. It contains largely the same shares as my personal portfolio, which has been run on a similar basis for a number of years.
Although this is a dividend portfolio, no income is withdrawn and all dividends are reinvested. For this reason, my main metric for measuring progress against the wider market is total return (share price change + dividends).
2023 performance:
- RH model portfolio total return: 3.0%
- FTSE 100 Total Return index: 8.4%
This chart shows the performance of the portfolio against the FTSE 100 Total Return index since the model portfolio's inception on 1 December 2021:
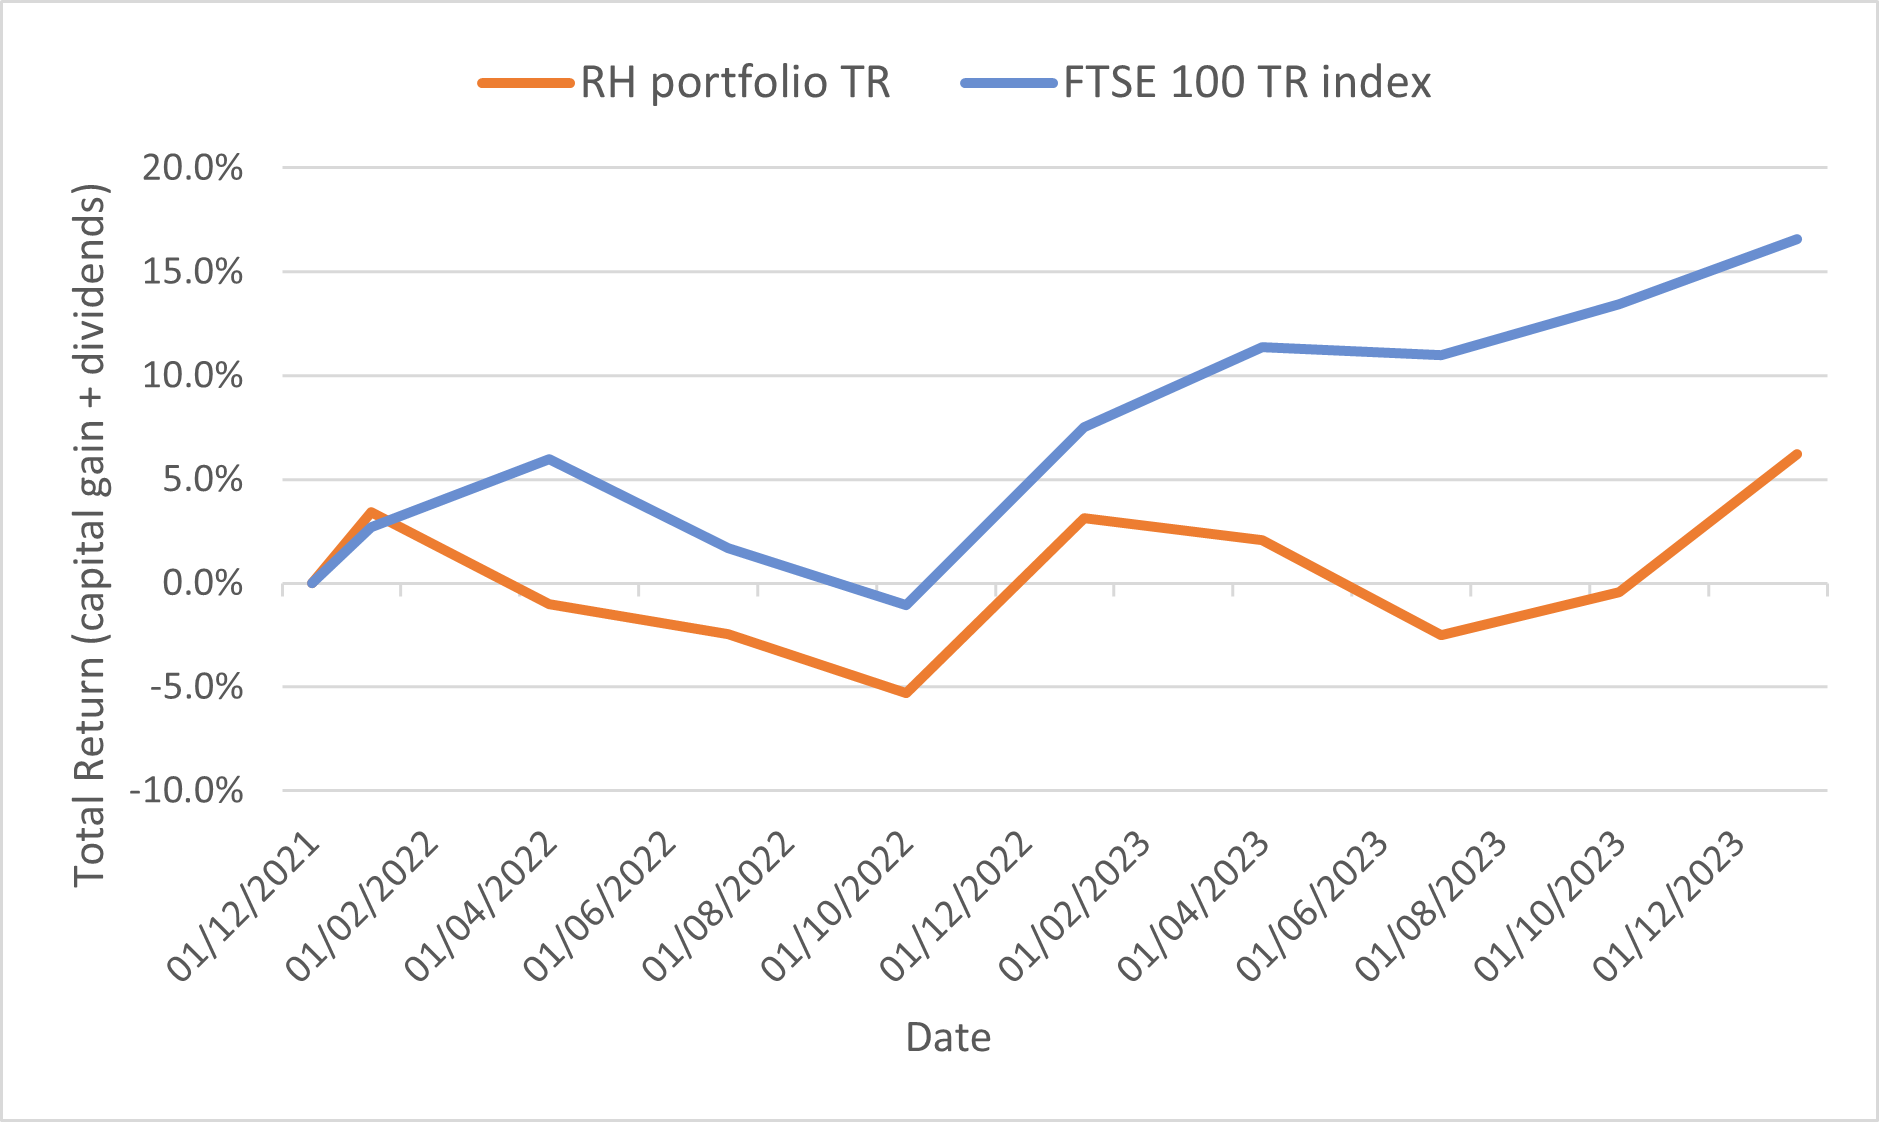
There's no escaping the fact that in the two years since its inception, I would have made more money by investing in a FTSE 100 tracker fund.
At the end of 2023, my efforts had produced a total return of just 6.2% since inception, compared to 16.6% for the FTSE 100 TR.
However, two years is a short time in equity investing and I'm encouraged by the portfolio's stronger performance in recent months.
I continue to believe that it's possible for me to beat the FTSE over longer periods by focusing on owning a selection of companies with above-average quality metrics, strong cash generation, and reasonable valuations.
I take some encouragement from the increase in dividends last year. Income generated by the model portfolio rose by nearly 5%:
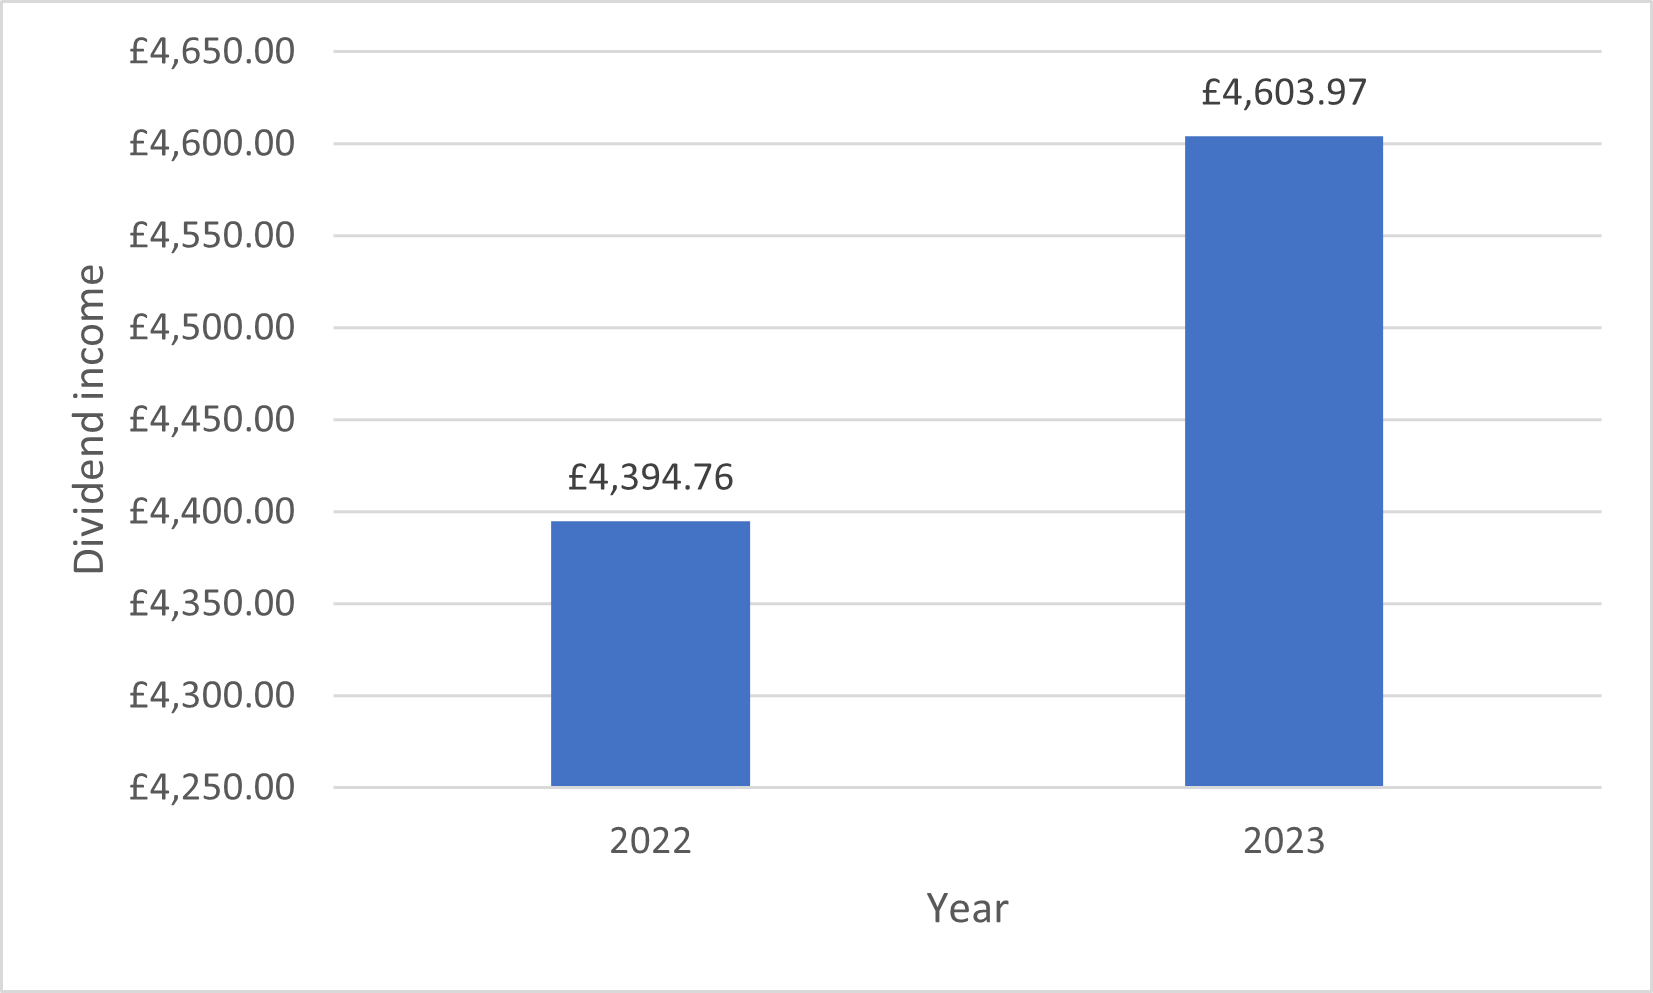
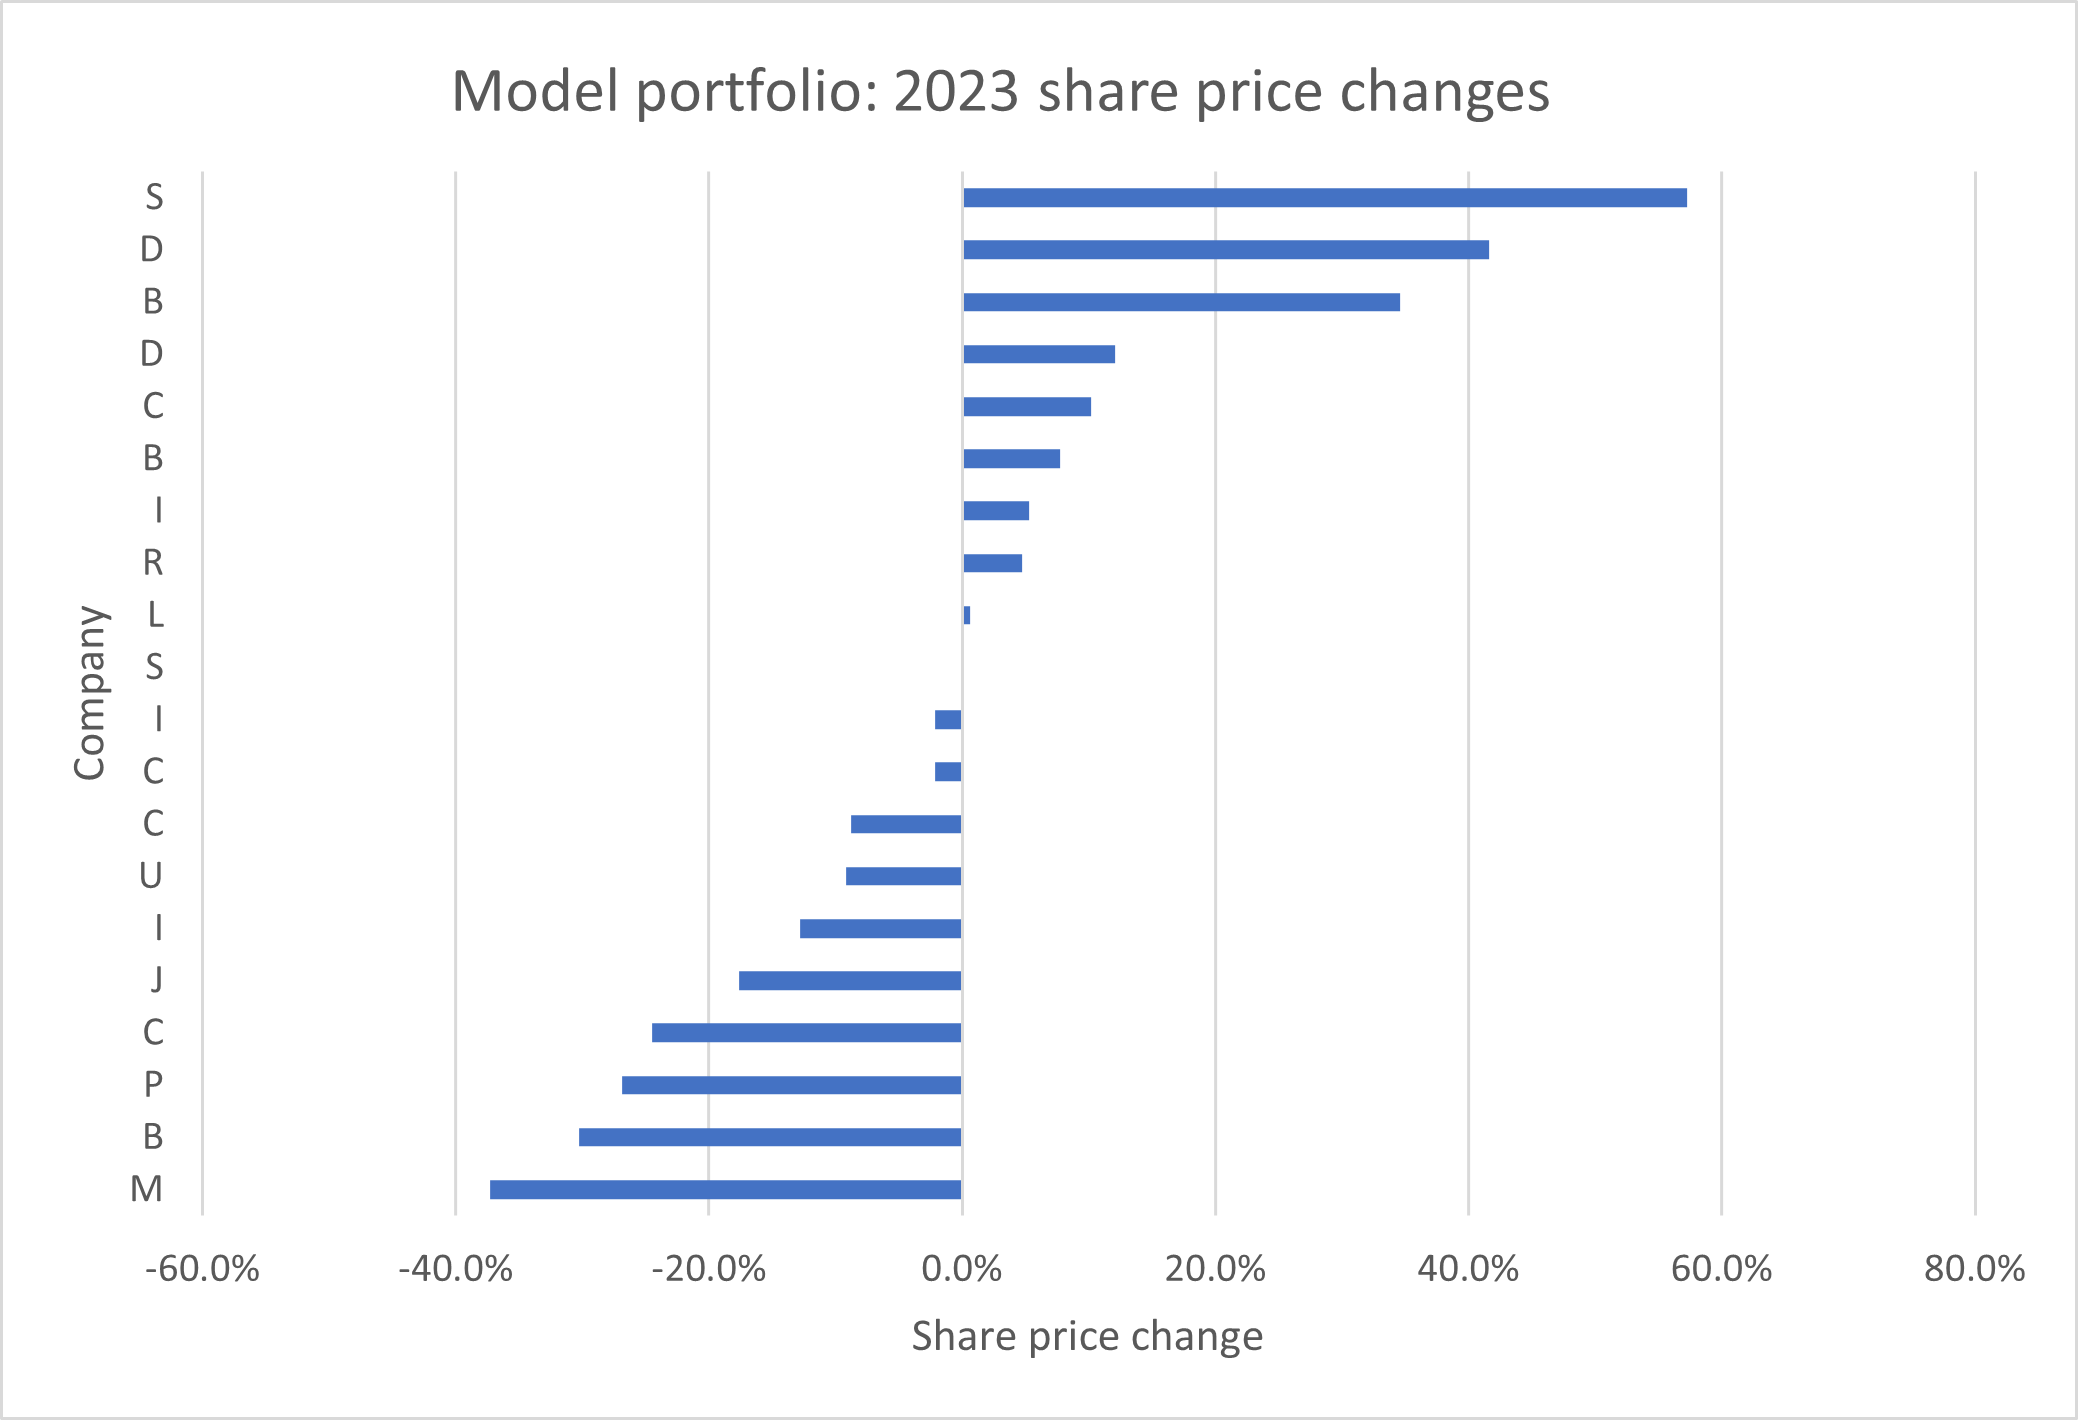
The stability of dividend income is one of its attractions for me. Compare the chart above to the wide range of share price movements seen within the portfolio last year:
Portfolio changes in 2023
My slow trading policy allows me to make up to two changes to the model dividend portfolio each quarter. I made changes in Q1 and Q3, but did not make any changes (except top ups) in Q2 or Q4.
Stocks sold in 2023
I sold three shares during the year. In each case, the (virtual) transaction took place on the final day of the quarter. My own real-money trades were similarly timed.
March 2023: Direct Line Insurance (LON:DLG) ran up big losses in 2022 and cancelled its final dividend. After a detailed review of the insurer's 2022 results and outlook, I decided to sell.
September 2023: I sold EMIS Group (LON:EMIS) when its takeover by a subsidiary of US healthcare group UnitedHealth was finally approved by the UK regulator.
I also decided to sell small-cap engineering group Concurrent Technologies (LON:CNC). I felt that the firm's more aggressive growth strategy and reduced free cash generation meant the shares may no longer offer the income potential I was looking for. Notwithstanding this, I think Concurrent probably remains a decent business with reasonable prospects.
Stocks bought in 2023
To replace Direct Line, EMIS and Concurrent, I added three new shares to the model portfolio and my own holdings.
Ahead of each purchase, I published a buy report for subscribers on each company:
- June 2023: A high-yield stock to replace Direct Line
- September 2023: A FTSE 250 share I'm buying for dividends and growth
- September 2023: Another new share for my dividend portfolio
In addition to these purchases, I also reinvested some of the model portfolio's accumulated dividend income by topping up a number of existing positions:
- June 2023: I topped up five positions - full list here
- December 2023: I topped up a further five positions - full list here
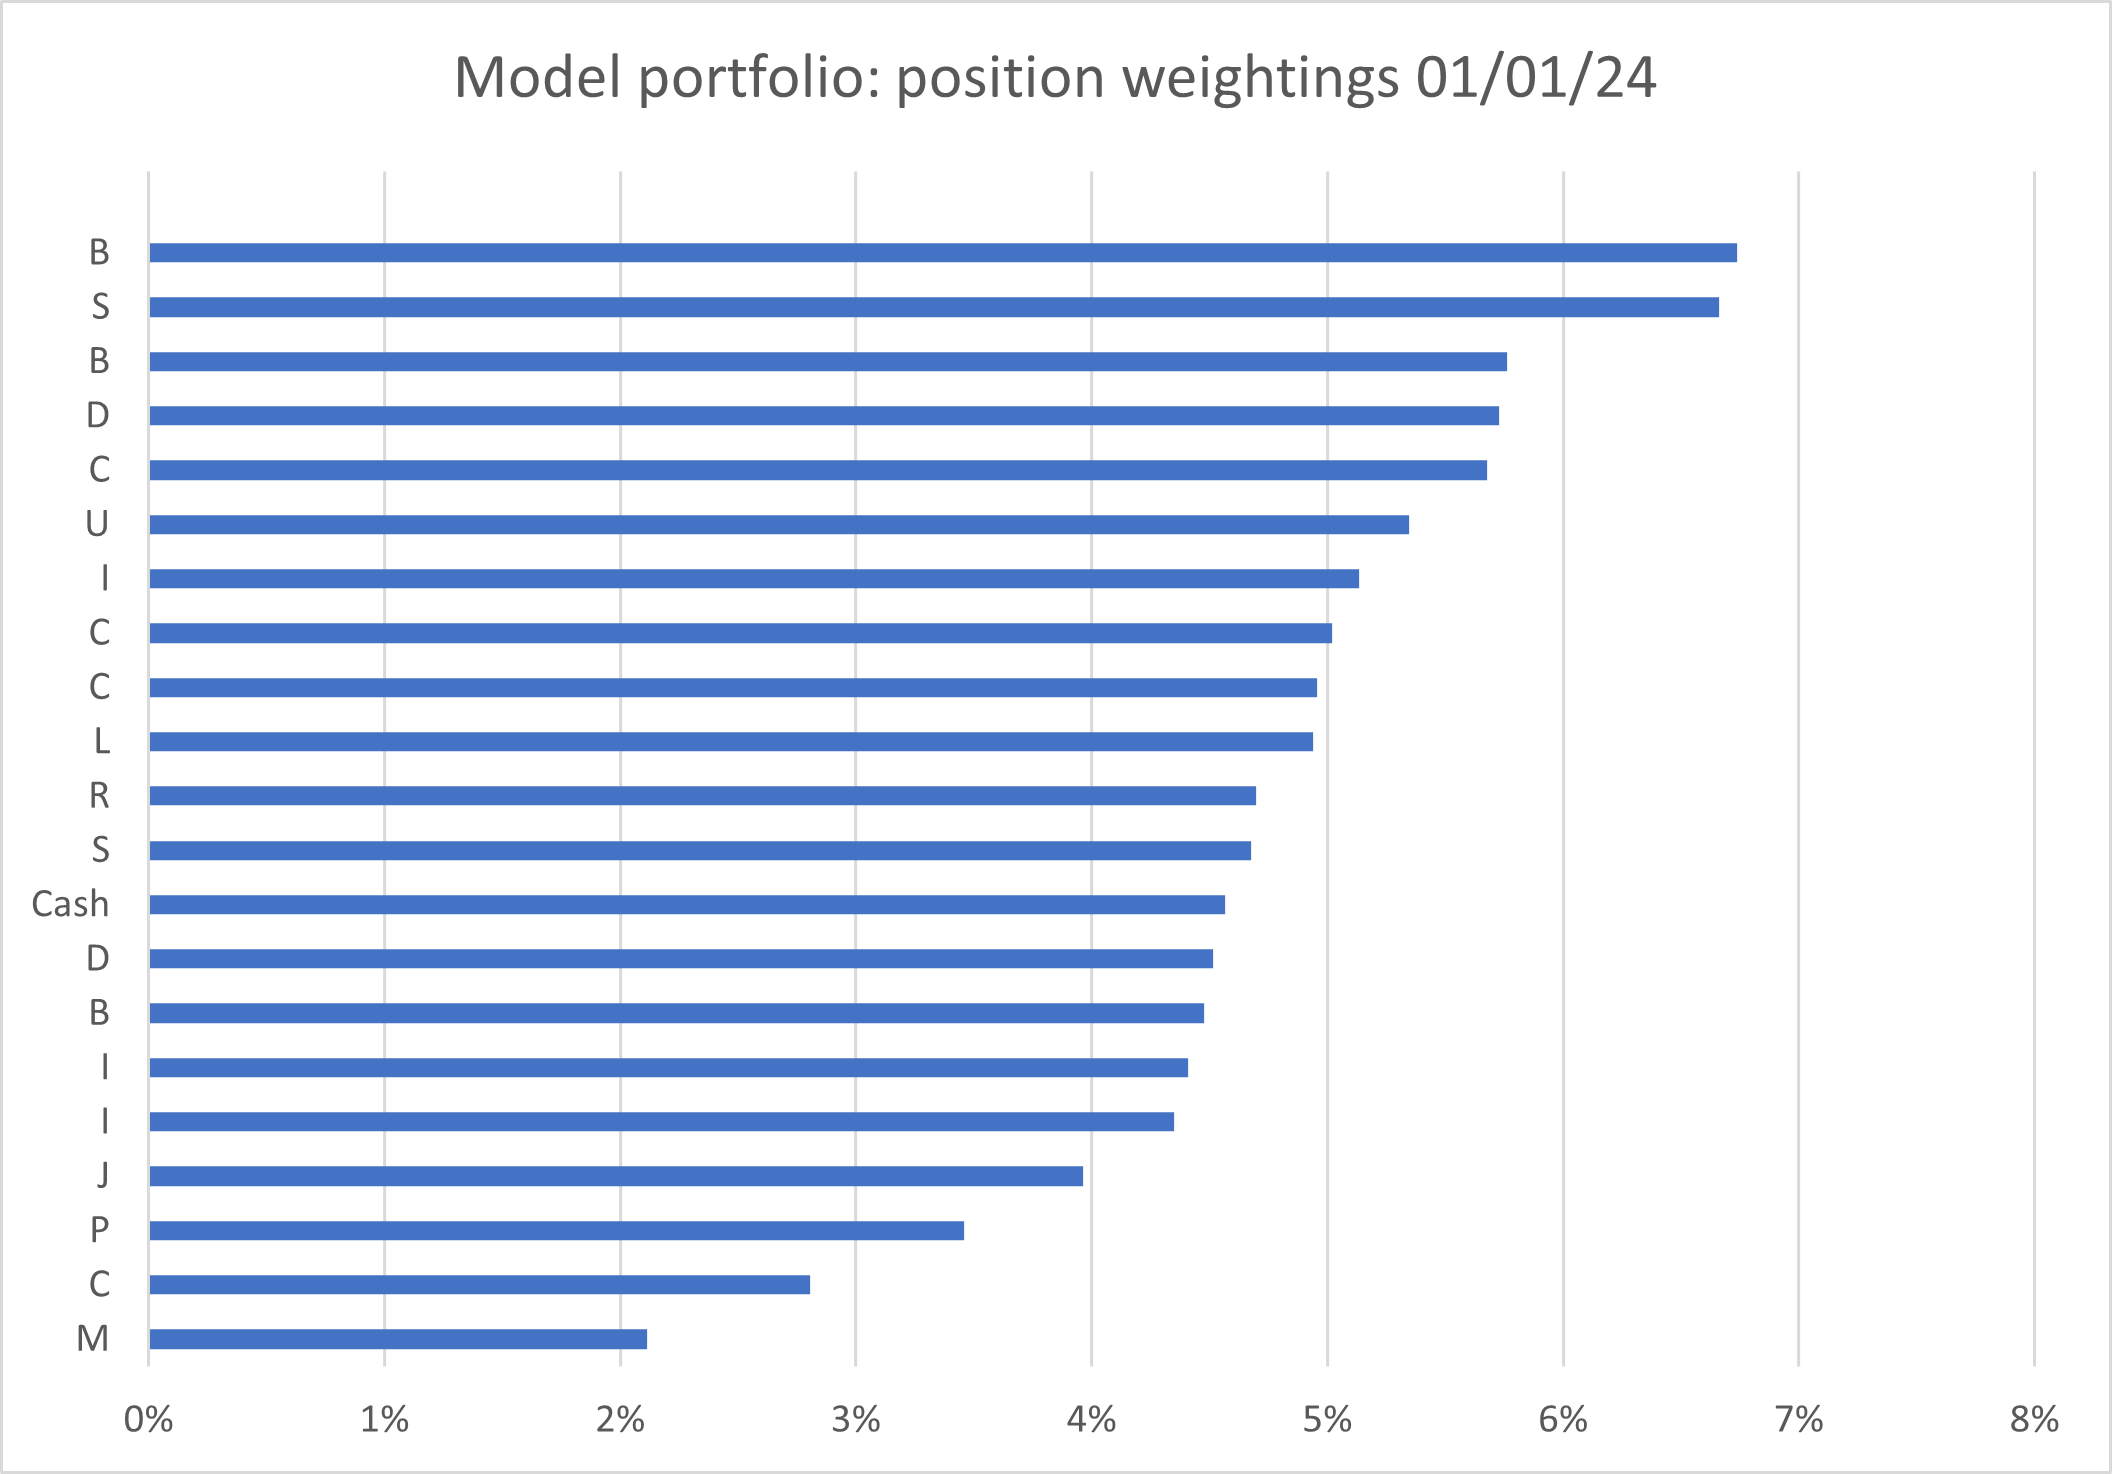
Portfolio weightings
Here's how my portfolio looked at the end of 2023, following last year's share price movements and the transactions listed above. Subscribers can see this chart with ticker codes included on my portfolio page:
Model dividend portfolio: financial metrics
Stock picking is fascinating and potentially rewarding, but ultimately the only result that matters is the performance of the portfolio. This is one reason why I like to monitor the financial profile of my whole portfolio, as if it was a single company.
Here's how the model portfolio looked at the end of December 2023:
| Median mkt cap |
TTM ROCE | TTM EBIT yield |
TTM FCF yield |
Net debt/5yr avg net profit |
TTM div yield |
5yr avg div grth |
F'cast div yield |
No. yrs div paid |
| £1.7bn | 21.0% | 11.3% | 7.1% | 0.2x | 5.3% | 6.3% | 5.2% | 24 |
Scroll L-R (Data source: SharePad/author analysis 04/01/2024. Some adjustments were needed; please don't take this as gospel.)
Pleasingly, these numbers are largely unchanged from those I reported at the end of the third quarter. I think they are an attractive set of figures, with the obvious caveat that averages can be used to mask ugly underlying figures.
However, I think there are a few points that are worth highlighting (good and bad).
Dividend yield: the portfolio's forecast dividend yield of 5.2% remains within my target range, but is down from 5.5% at the end of the third quarter. I think this is mainly due to share price gains, which I can live with.
Perhaps more significantly, this forecast yield is now slightly lower than the portfolio's trailing yield of 5.3%. This implies that the overall payout from the portfolio might shrink slightly this year. I think this reflects some company-specific expectations:
- one cyclical company in the portfolio is expected to pay a reduced dividend this year, due to its earnings-linked dividend policy
- two of the companies in the portfolio seem unlikely to repeat last year's generous special dividends
Actual dividend yield: the yield figures above assume an equally weighted portfolio. In reality, position weightings vary and this may affect the actual cash yield received.
Buying and selling shares can also affect income received, as trading often results in missed dividends.
Other metrics: the portfolio's median market cap of £1.7bn is unchanged, while trailing return on capital employed of 21% is down slightly from 22.3% at the end of Q3. I think this reflects profit drops at one or two of the portfolio's more cyclical businesses.
Happily, aggregate leverage remains low, with net debt representing an average of just 0.3x five-year average net profit.
In terms of valuation, the TTM EBIT yield of 11.3% and TTM FCF yield of 7.1% are both slightly below the level reported at the end of Q3 (11.9% / 8.5%). I think this is probably due to recent share price gains. However, both of these these metrics still represent good value, in my view.
More importantly, the free cash flow yield of 7.1% covers the portfolio's trailing dividend yield of 5.3%. This implies that in aggregate, last year's payouts were covered by free cash flow – suggesting they remain affordable.
Dividend history: the companies in the portfolio have paid dividends for an average of 24 consecutive years, according to SharePad data.
Although this period may have included some cuts, I think it's still a useful indicator of their commitment to maintaining the shareholder payout.
Final thoughts
Given that stock markets tend to look ahead of the real economy, I'm cautiously optimistic that 2024 might be a slightly better year for investors than 2022 and 2023. I could be wrong though.
Although inflation now appears to be easing, the impact of higher interest rates is still feeding through to borrowing costs and company profits (and consumers).
I expect interest rates to remain roughly at current levels, so I'll continue to focus on companies with minimal net debt or net cash positions. I may also take a more critical view of those few companies in the portfolio which are more heavily reliant on debt.
Whatever happens, I'm going to continue following the same process in 2024 – using valuation, quality and cash flow metrics to try and identify high-quality dividends.
As always, thank you for reading and supporting this project.
Please feel free to get in touch with any questions or feedback – you can reach me by email or on X / Twitter.
Roland Head
Disclaimer: This is a personal blog/newsletter and I am not a financial adviser. All content is provided for information and educational purposes only. Nothing I say should be interpreted as investing advice or recommendations.
You should carry out your own research and make your own investing decisions. Investors who are not able to do this should seek qualified financial advice. Reasonable efforts are made to ensure that information provided is correct at the time of publication, but no guarantee is implied or provided. Information can change at any time and past articles are not updated.