H1 2022: Quality Dividend model portfolio review
How has my quality dividend model portfolio performed during the first six months of 2022?


After a difficult Q1 (due partly to some unforced errors), I'm pleased to report that the performance of my quality dividend model portfolio stabilised during the second quarter.
Although the portfolio is still lagging behind its FTSE 100 ETF benchmark, I'm not too unhappy with the current situation. After all, six months is an exceedingly short period of time for stock market investment, especially when those months have included the start of a European war and a sudden surge in inflation.
Portfolio performance
Here are the headline numbers for the portfolio's performance during the six months to 30 June 2022:
- H1 2022 model portfolio total return: -5.6%
- H1 2022 model portfolio dividend income: 2.4%
- FTSE 100 H1 2022 dividend income: 1.9%
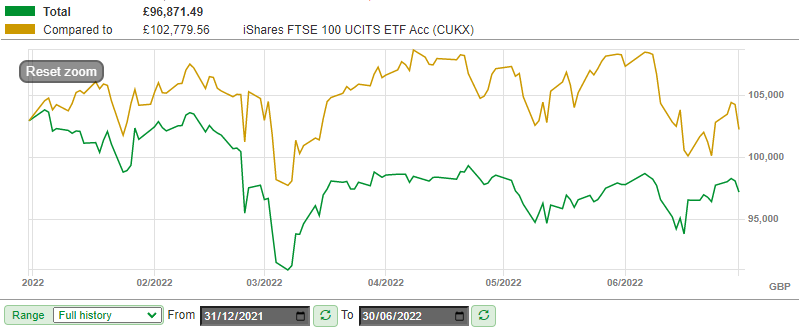
As I reinvest all dividends and do not make any withdrawals, the benchmark I use for the model portfolio is the iShares Core FTSE 100 ETF Acc (CUKX). This is an accumulator fund, so dividends are automatically added to the unit value of the ETF. This is the closest fund analogue I can find to my approach.
- CUKX H1 2022 total return: -0.7%
As this SharePad chart shows, my model portfolio clawed back lost ground against the benchmark during the latter part of H1, but is still lagging this low-cost ETF on a year-to-date basis:
As is often the case, the portfolio' stable performance since March has masked a much wider range of individual share price performances. Here is a chart showing share price performance for the portfolio during the first half of this year:
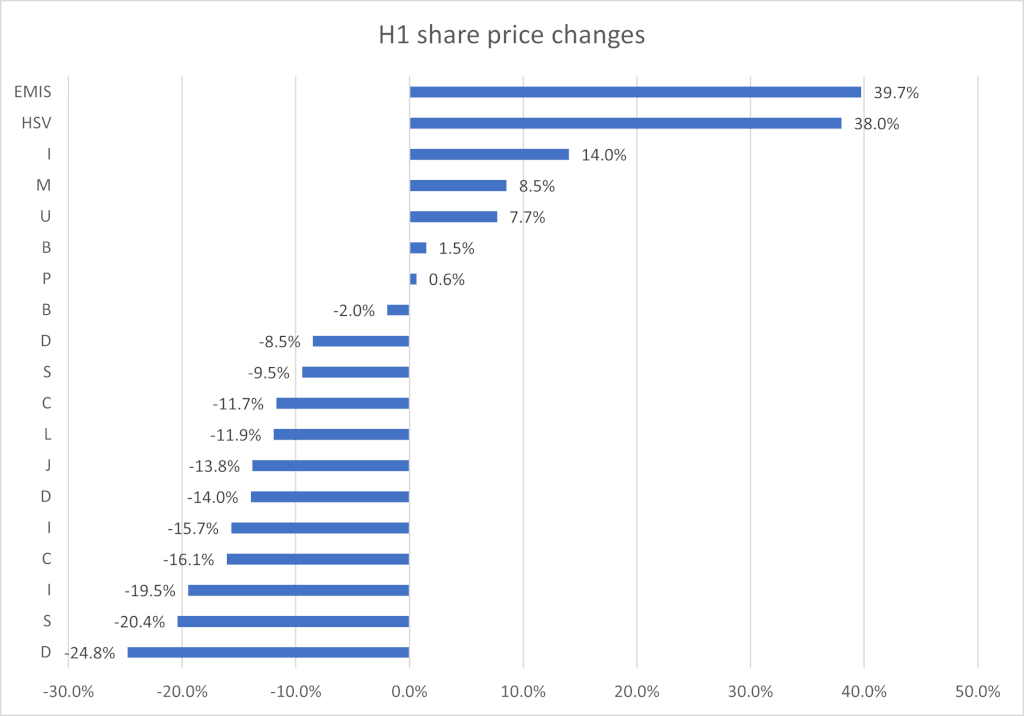
Both Homeserve (HSV) and EMIS (disclosure: I hold) received takeover bids during the half year, hence their outsized gains.
The biggest losers in the portfolio were mostly FTSE 250 consumer stocks and other cyclical businesses caught in this year's market sell off. Time will tell whether I added these stocks to the model portfolio at too high a price, or whether this is just a temporary period of negative sentiment towards what I believe are good businesses.
Model portfolio: As a quick reminder, my quality dividend model portfolio is a virtual fund that's run using my dividend screening system.
The model portfolio contains the same stocks as my personal portfolio, but the two aren't exactly the same. Many of my personal holdings pre-date the model portfolio and have different cost prices.
Additionally, the model portfolio has been constructed with a single lump sum of virtual cash in order to make tracking performance easier. My own share dealing account gets topped up from my income each month.
In the remainder of this review, I'll explain the changes I made to the portfolio during the second quarter and take a look at the portfolio's key dividend quality metrics.
Stocks sold during Q2
During the first quarter of 2022, three stocks left the portfolio. You can read about them in my Q1 update. During the second quarter, there was only one sale – Homeserve.
This sale was due to the company's ongoing takeover bid. To free up cash for new purchases I decided to sell the portfolio's shares (and my own) ahead of the bid completing.
| Company (ticker) | Date purchased | Purchase price | Date sold | Sale price | Total return (inc dividends) |
| Homeserve (LON: HSV) | 1 April 2022 | 850p | 30 June 2022 | 1,172p | 38% |
New stocks in Q2
At the start of the second quarter, the portfolio had 19 stocks. This fell to 18 with the disposal of Homeserve.
Although I'm targeting 20 holdings, I only added one new stock during the second quarter. This means that I'll still need at least two more over the remainder of this year, when the EMIS takeover is factored in (I still hold EMIS).
New stock: You can read about the new company I've added to the portfolio in this piece from June: "A 170-year-old business to replace Homeserve".
Over the next three months, I aim to find at least one more new stock to add to the model dividend portfolio. As usual, I'll write about it here and then add it to the portfolio on the first day of the next quarter.
Quality dividend model portfolio: financial metrics
The performance of individual stocks is fascinating and can be very satisfying. But the only thing that really matters in financial terms is the performance of the portfolio.
For this reason, I like to look at the aggregate characteristics of my portfolio to see if – collectively – the companies I've chosen are displaying the kind of qualities I'm looking for.
I admit that I've borrowed this technique from Fundsmith founder Terry Smith. He describes it as a way of visualising a portfolio as a single business.
Here's how my quality dividend model portfolio looked, in aggregate, at the end of June 2022 (the Q1 figures are here):
| Median mkt cap | TTM ROCE | TTM EBIT yield | TTM FCF yield | Net debt/5yr avg net profit | TTM div yield | 5yr avg div grth | F'cast div yield | No. yrs div paid |
| £1.6bn | 23.5% | 10.3% | 7.7% | -0.1x | 4.5% | 7.9% | 5.0% | 20 |
(Source: SharePad/author analysis - some manual adjustments were needed; don't take this as gospel)
Comment: I'm very comfortable with these metrics. Collectively they suggest to me that my portfolio contains highly profitable, cash-generative and growing companies.
The portfolio's forecast dividend yield of 5% is comfortably ahead of the FTSE 100's 3.8% yield. Meanwhile, the portfolio's five-year average dividend growth rate of 7.9% gives me hope that income from the portfolio will broadly keep pace with inflation.
An average return on capital employed (ROCE) of 23.5% tells me that collectively, at least, my companies are significantly more profitable than average. To give this number some context, over the last 12 months, the companies in the portfolio have generated ROCE ranging from 5.5% to 79%. Median ROCE is 18.4%.
An average EBIT yield of 10.3% suggests a reasonable valuation. This yield figure has risen from 8.3% over the last quarter, reflecting falling share prices and the switch from Homeserve to my new stock.
The trailing 12-month (TTM) free cash flow yield of 7.7% is higher than the TTM dividend yield of 4.5%. That implies that collectively, my companies' dividends have been covered 1.6x by free cash flow over the last year.
Looking ahead, dividend yield growth of 0.5% implies an 11% increase in portfolio dividend payments over the coming year. That's reasonably close to the portfolio's five-year average dividend growth rate of 7.9%, which seems reassuring to me.
Finally, the companies in my portfolio have paid dividends every year for an average of 20 years. Although these histories may have included some dividend cuts, I think this is a decent record.
I recognise that these portfolio averages may be masking problems with individual businesses. However, I feel comfortable that the portfolio is displaying the qualities I'm looking for in quality dividend investments.
I don't plan to make any voluntary changes to the portfolio this quarter, other than to select a 20th stock.
Disclaimer: This is a personal blog. The information provided is for information and interest. Nothing I say should be construed as investing advice or recommendations. The investing approach I discuss relates to the system I use to manage my personal portfolio. It is not intended to be suitable for anyone else.
You should carry out your own research and make your own investing decisions. Investors who are not able to do this should seek qualified financial advice. Reasonable efforts are made to ensure that information provided is correct at the time of publication, but no guarantee is implied or provided. Information can change at any time and past articles are not updated.