Q1 2022: Quality Dividend model portfolio review


Welcome to the first quarterly review of my quality dividend model portfolio.
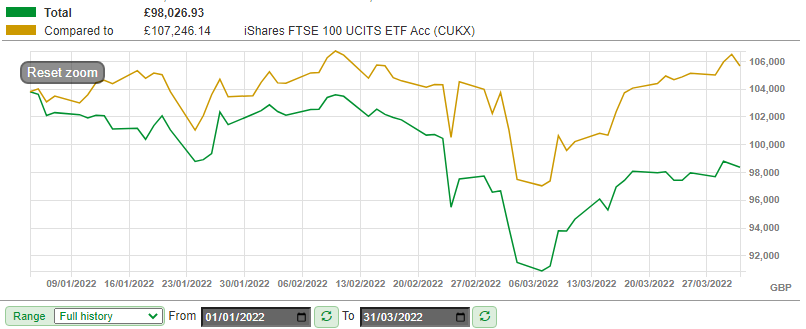
My virtual portfolio has had a mixed start to the year and ended the first quarter down slightly. But the news hasn't all been bad. Let's start with the headline numbers.
- Q1 portfolio total return: -4.4%
- Q1 portfolio dividend income: 1.1%
- FTSE 100 Q1 dividend return: 1.1%
To put this in context, the iShares Core FTSE 100 ETF Acc (CUKX) I use as a benchmark delivered a total return of +3.4% over the period.
As a quick reminder, the quality dividend model portfolio is a virtual fund that's run using my dividend screening system.
The model portfolio contains the same stocks as my personal portfolio, but the two aren't exactly the same. Many of my personal holdings pre-date the model portfolio.
Additionally, the model portfolio has been constructed with a single lump sum of virtual cash in order to make tracking performance easier. My own share dealing account gets topped up from my income each month.
In this review I'll drill down into the portfolio performance during the period and take a look at some key dividend quality metrics.
I'll also review trading activity in the portfolio during the quarter and discuss my plans for the next three months.
Sold stocks
I'll start with the three stocks I sold from the portfolio during the quarter , as one of these made an outsized contribution to the portfolio's loss for the period.
My plan is to be a very inactive trader, but these sales were largely forced on me due to circumstances. I hope that this level of portfolio churn will be the exception, not the rule.
I've circled the three sold stocks on the chart below. Full details of the portfolio are available to free subscribers:
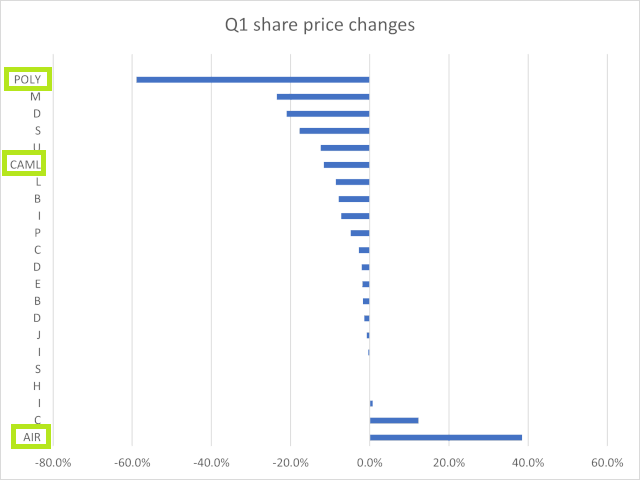
- Air Partner (LON: AIR) was sold due to a takeover bid - sale report here.
- Polymetal International (LON: POLY) was sold due to its Russian exposure. Sale report here.
- Central Asia Metals (LON: CAML) was sold due to the close alliance between Kazakhstan and Russia and my perception of the risk this might pose. Sale report here.
You can read my sale report on each stock by clicking on the links above.
Here are the details of the overall profit or loss from each of these sales. Fortunately, the Air Partner takeover helped to offset the losses from Polymetal and CAML.
| Company (ticker) | Date purchased | Purchase price | Date sold | Sale price | Total return (inc dividends) |
| Air Partner (LON: AIR) | 1 Dec 2021 | 79p | 25 Feb 2022 | 122p | 55% |
| Polymetal International (LON: POLY) | 1 Dec 2021 | 1,364p | 25 Feb 2022 | 746.4p | -45.6% |
| Central Asia Metals (LON: CAML) | 1 Dec 2021 | 243.5p | 3 Mar 2022 | 229p | -6.4% |
New stocks
Selling three stocks left the portfolio looking somewhat depleted.
My originally strategy for selling and replacing stocks stipulated a limit of two trades per quarter. After some thought, I've decided to stick with this limit, despite the unusual circumstances of the last two months.
There are a couple of reasons for this. I want to control the pace of portfolio churn, and I also think there's some value in drip-feeding new companies into a portfolio. Market conditions may well change further over the next quarter, creating some fresh opportunities.
My experience is generally that buying periodically can deliver better results than all at once. The only exception to this is when I've been able to buy during a market crash, when the problem is having too much choice.
I added two new shares to the portfolio on 1 April, after writing them up on this website during March.
New stock #1: Homeserve
Shortly after publishing my buy report on Homeserve (LON: HSV), shares in this home repair provider surged higher on news that private equity group Brookfield Asset Management was considering an offer for the business.
There's been no further deal news since the initial announcement on 24 March.
Although Homeserve's share price is now around 20% higher than when I picked the stock, it's still below mid-2021 levels and well below historic highs.
On balance, I think Homeserve still looks reasonably valued on a long-term view, so I went ahead and added it to the portfolio on 1 April. You can see full details on the portfolio page.
New stock #2: US exposure from a UK stock
Details of my second new pick are only available to free subscribers, who can read my 25 March buy report "Portfolio shares: adding US exposure to the portfolio".
Q2 buying plans
One more stock is needed to bring the portfolio up to its target size of 20 holdings.
I plan to leave this slot vacant until the next quarterly review at the start of July. During this quarter I will research and select a replacement stock. I'll publish a buy report here before I add the new company to the portfolio.
In Q2 I will run the portfolio with 19 stocks, barring any more unforeseen selling events.
Quality dividend portfolio: financial characteristics
While the success or failure of individual stock picks is interesting, it's the portfolio result that really matters. For this reason, I want to wrap up this quarterly review with a look at some quality metrics for the portfolio as a whole.
This technique is borrowed from fund manager Terry Smith. He reports the aggregate financial characteristics of the stocks in his Fundsmith portfolios, so that they appear as a single business.
I've done this for the quality dividend portfolio below. Changes since the end of 2021 are minimal (2021 review here), but I've tweaked the contents of the table slightly this time.
| Median mkt cap | TTM ROCE | TTM EBIT yield | TTM FCF yield | Net debt/5yr avg net profit | TTM div yield | 5yr avg div grth | F'cast div yield | No. yrs div paid |
| £2.9bn | 23% | 8.3% | 6.8% | 0.1x | 4.2% | 8.5% | 4.7% | 20 |
(Source: SharePad/author analysis - some manual adjustments were needed; don't take this as gospel)
What does this tell me? I think these numbers tell a positive story.
An EBIT yield of 8.3% looks reasonable value to me, although this average does mask a wide range of individual valuations.
The portfolio's trailing 12-month free cash flow yield of 6.8% is greater than its trailing dividend yield of 4.2%. This implies that collectively, my companies have paid dividends covered 1.6x by free cash flow over the last year. That seems reassuring to me.
Looking ahead, the increased forecast yield for this year implies expected dividend growth of 11.9% across the portfolio, well ahead of inflation. This growth rate is slightly ahead of the five-year average dividend growth rate of 8.3%, but not outlandishly so, given the element of post-pandemic recovery in many businesses.
Finally, the companies in the portfolio have an average return on capital employed of around 23% and have paid dividends for the last 20 years, on average.
To me, these seem like attractive qualities for an income portfolio. I remain comfortable with all the stocks in the portfolio and do not plan any changes this quarter, other than selecting a 20th stock.
Disclaimer: This is a personal blog. The information provided is for information and interest. Nothing I say should be construed as investing advice or recommendations. The investing approach I discuss relates to the system I use to manage my personal portfolio. It is not intended to be suitable for anyone else.
You should carry out your own research and make your own investing decisions. Investors who are not able to do this should seek qualified financial advice. Reasonable efforts are made to ensure that information provided is correct at the time of publication, but no guarantee is implied or provided. Information can change at any time and past articles are not updated.