Q3 2022: Quality dividend portfolio review
How did my quality dividend portfolio perform during the third quarter of 2022?


I think it's probably fair to say that the third quarter of 2022 brought some surprises in the market, not all of them welcome.
I've not made any changes to my model dividend portfolio in response to the recent sell off, nor will I be.
However, in my personal portfolio – which holds the same stocks but is topped up regularly – I'm planning to put my cash balance to work over the coming weeks, topping up some of my existing holdings.
Portfolio performance
Here are the headline numbers for the portfolio's performance during the third quarter of 2022.
Q3 2022:
- Model portfolio total return: -4.7% (including 1% dividend income)
- FTSE 100 total return: -3.7% (including 0.9% dividend income)
Nine months to 30 September 2022:
- Model portfolio total return: -9% (including 3.4% dividend income)
- FTSE 100 total return: -3.7% (including 2.8% dividend income)
Here's how the my model dividend portfolio has performed against my benchmark FTSE 100 tracker ETF (iShares CUKX). As a reminder, this is a model (virtual) portfolio.
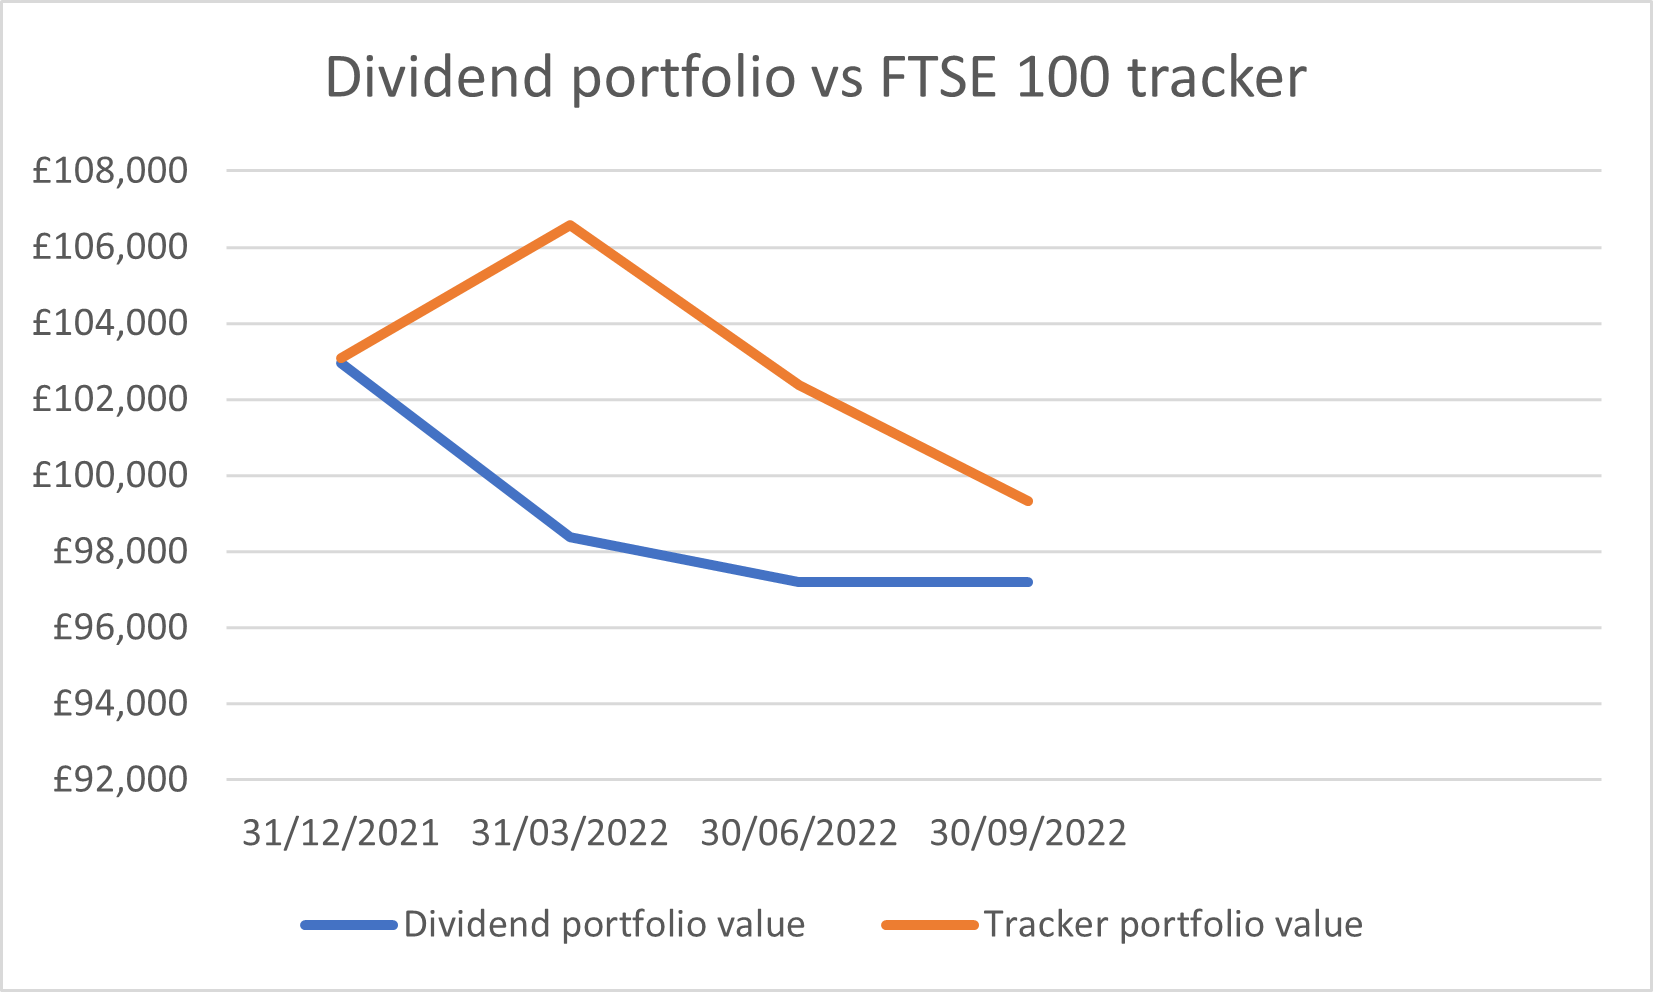
The model portfolio has broadly tracked the FTSE 100 for most of the year, but hasn't yet recovered from the impact of the Ukraine invasion.
The sharp drawdown during Q1 was the result of my unfortunate decision to invest in Russian gold miner Polymetal International. I've covered that investment and the subsequent changes to my investment strategy here.
Of course, portfolio movements usually mask a far wider range of individual share price movments. Here's a chart showing how the stocks in my portfolio rose and fell during Q3:
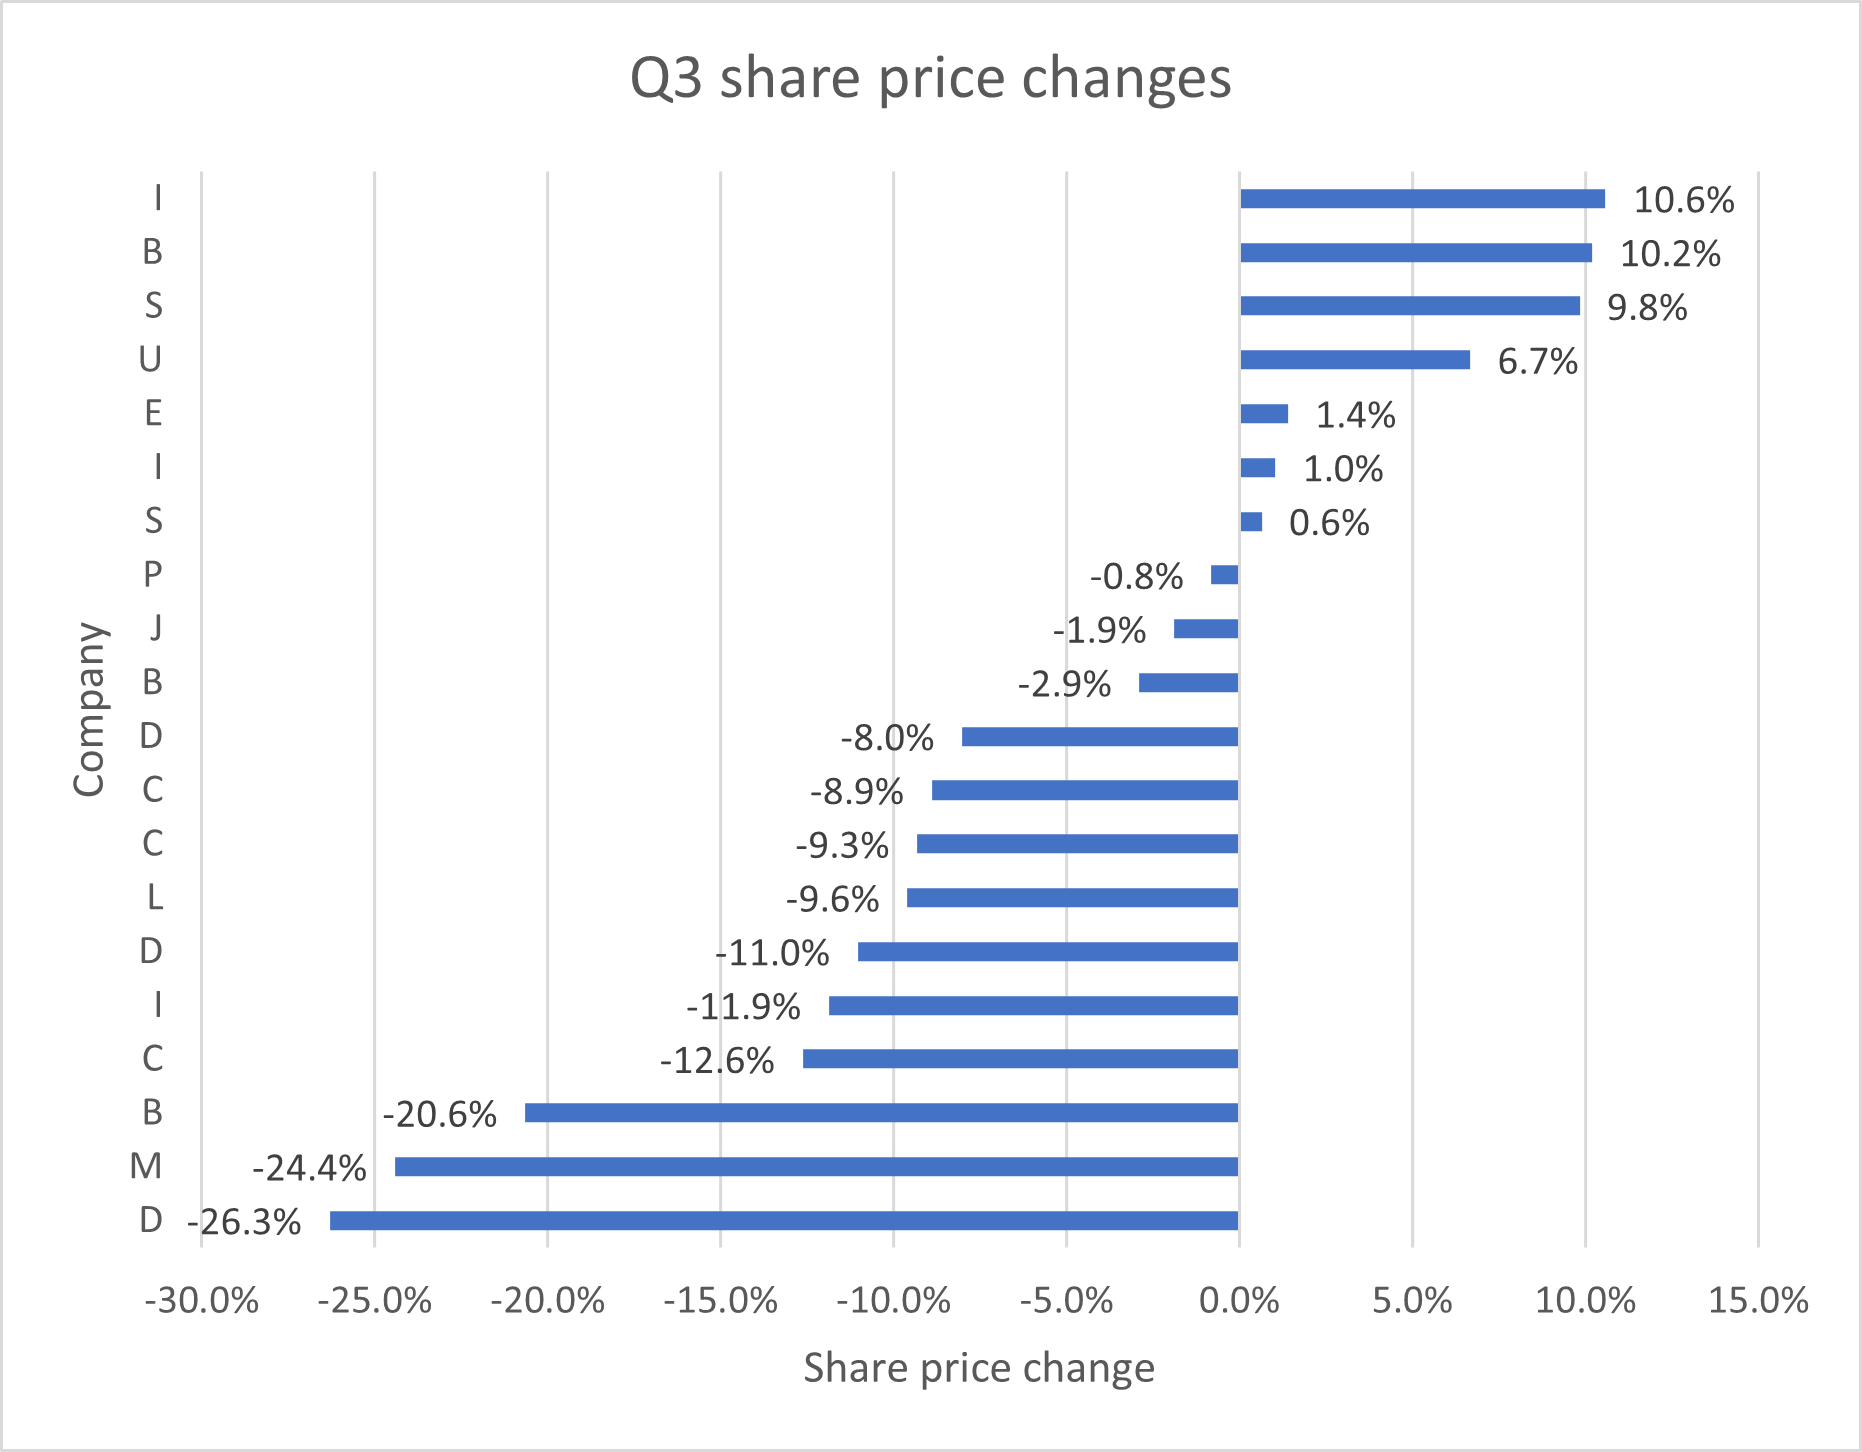
You can see full details of all portfolio shares here.
The majority of fallers in the portfolio during Q3 were those with exposure to a cyclical downturn, especially in consumer sectors.
However, there were a couple of outliers, too. Among the top fallers were a small-cap industrial and a financial stock. I'm holding onto both as I think that they are starting to look oversold and have good medium-term prospects.
Model portfolio: As a quick reminder, my quality dividend model portfolio is a virtual fund that's run using my dividend screening system.
The model portfolio contains the same stocks as my personal portfolio, but the two aren't exactly the same. Many of my personal holdings pre-date the model portfolio and have different cost prices.
Additionally, the model portfolio has been constructed with a single lump sum of virtual cash in order to make tracking performance easier. My own share dealing account gets topped up from my income each month.
In the remainder of this review, I'll explain the changes I made to the portfolio during the second quarter and take a look at the portfolio's key dividend quality metrics.
Stocks sold during Q3
I did not sell any shares from the model portfolio during Q3 2022.
New stocks in Q3
I added two new stocks to the model portfolio (and my own holdings) during the third quarter. Subscribers can read about each of these new stocks in the articles below:
These purchases were made to replace earlier disposals from the portfolio following the takeovers of Air Partner and Homeserve.
As things stand today, the portfolio has 20 stocks, which is my target size. However, this should fall to 19 by the end of the year, assuming the takeover of software group EMIS completes as planned.
This gives me the scope to add one company to the portfolio over the coming months, if I can find a suitable opportunity in my screening results.
Quality dividend model portfolio: financial metrics
The performance of individual stocks is fascinating and can be very satisfying. But the only thing that really matters in financial terms is the performance of the portfolio.
For this reason, I like to look at the aggregate characteristics of my portfolio to see if – collectively – the companies I've chosen are displaying the kind of qualities I'm looking for.
I admit that I've borrowed this technique from Fundsmith founder Terry Smith. He describes it as a way of visualising a portfolio as a single business.
Here's how my quality dividend model portfolio looked, in aggregate, at the end of September 2022 (the H1 figures are here):
| Median mkt cap | TTM ROCE | TTM EBIT yield | TTM FCF yield | Net debt/5yr avg net profit | TTM div yield | 5yr avg div grth | F'cast div yield | No. yrs div paid |
| £1.8bn | 22.8% | 11.8% | 8.1% | -0.1x | 4.9% | 8.4% | 5.3% | 21 |
(Source: SharePad/author analysis - some manual adjustments were needed; don't take this as gospel)
Comment: Despite the market ructions of the last three months, the metrics in the table above have only changed slightly since the first half. Falling share prices mean that yield measures have generally increased.
Meanwhile, pressure on profit margins at some of my companies means that the portfolio's mean return on capital employed (ROCE) is slightly lower than it was three months ago (H1: 23.5%).
I'm not concerned by these shifts. Indeed, I'm quite encouraged by the numbers.
The portfolio's aggregate free cash flow yield of 8.1% suggests value to me. It also tells me that my stocks' cash generation should be sufficient to cover the forecast dividend yield of 5.3%.
If my companies deliver dividends as forecast, then the portfolio will generate dividend income growth of 8.2% this year, nearly matching UK inflation.
In terms of valuation, an EBIT yield of 11.8% is comfortably above the 8% level I view I use as a rule-of-thumb test for good value.
Similarly, the portfolio's average ROCE of 22.8% is well above the wider market average. This suggests that the businesses in my portfolio are significantly more profitable than average. I'd expect that to support market-beating long-term growth, in aggregate.
Of course, there's no guarantee this purely numerical assessment will translate into a winning portfolio. One particular risk is that I've chosen companies that have performed well in the past but won't in the future.
As I've commented before, another risk is that these attractive portfolio averages could be masking problems with individual businesses.
However, I remain comfortable that my portfolio is displaying the attributes I look for in good quality dividend investments. I don't plan to make any voluntary changes to the portfolio during the final quarter of this year, except to try and select a replacement for EMIS.
Disclosure: At the time of publication, Roland owned shares in EMIS.
Disclaimer: This is a personal blog. The information provided is for information and interest. Nothing I say should be construed as investing advice or recommendations. The investing approach I discuss relates to the system I use to manage my personal portfolio. It is not intended to be suitable for anyone else.
You should carry out your own research and make your own investing decisions. Investors who are not able to do this should seek qualified financial advice. Reasonable efforts are made to ensure that information provided is correct at the time of publication, but no guarantee is implied or provided. Information can change at any time and past articles are not updated.