
Q1 2023: a big loss leaves me lagging the market
There was good and bad news for my quality dividend portfolio perform during the first quarter of 2023. In this review, I crunch the numbers.


UK markets started this year with a burst of optimism before the banking crisis delivererd a reminder that rising interest rates could have consequences.
My own quality dividend model portfolio did not escape unscathed, although in this case the damage can't really be linked to the impact of rising interest rates. Instead, it was just old-fashioned mismanagement (in my opinion...).
However, the beauty of a reasonably diversified portfolio is that it allows you to absorb the inevitable mishaps of investing and keep moving forwards.
During this quarter I'm looking forward to adding a new stock to the model portfolio and reinvesting dividend income that has accumulated over the last year.
Portfolio performance
To recap, the portfolio I'm discussing here is my quality dividend model portfolio, which is run using my dividend screening system.
The model portfolio was launched on 1 December 2021, but it contains largely the same shares as my personal portfolio, which has been run on a similar basis for a number of years.
One key difference is that the model portfolio is based on a single lump sum, rather than regular investments. This makes it much simpler to track performance.
Here are the performance figures for the first quarter of 2023.
Q1 2023:
- Model portfolio total return: -1% (including 1.1% dividend income)
- FTSE 100 total return: +3.5% (including 1.1% dividend income)
This chart shows the portfolio's performance against its FTSE 100 tracker benchmark since its inception on 1 December 2021. Both lines show total return (capital return + dividends):
The model portfolio largely held onto the gains made during the autumn. But it did not manage to catch up with the FTSE 100. This was due in part to big gains for a blue chip heavyweights such as Flutter Entertainment, BT, Rolls-Royce, BAE Systems, and Tesco during Q1.
As a market-cap weighted index, gains for big companies have a disproportionate impact on the FTSE 100. That's not true in a typical share portfolio, where position weighting is independent of market cap.
Another factor that weighed on my portfolio was the 40% fall in Direct Line's share price. I estimate this could have caused a drag of nearly 2%. As a FTSE 250 stock, Direct Line's slump didn't affect my FTSE 100 index tracker benchmark.
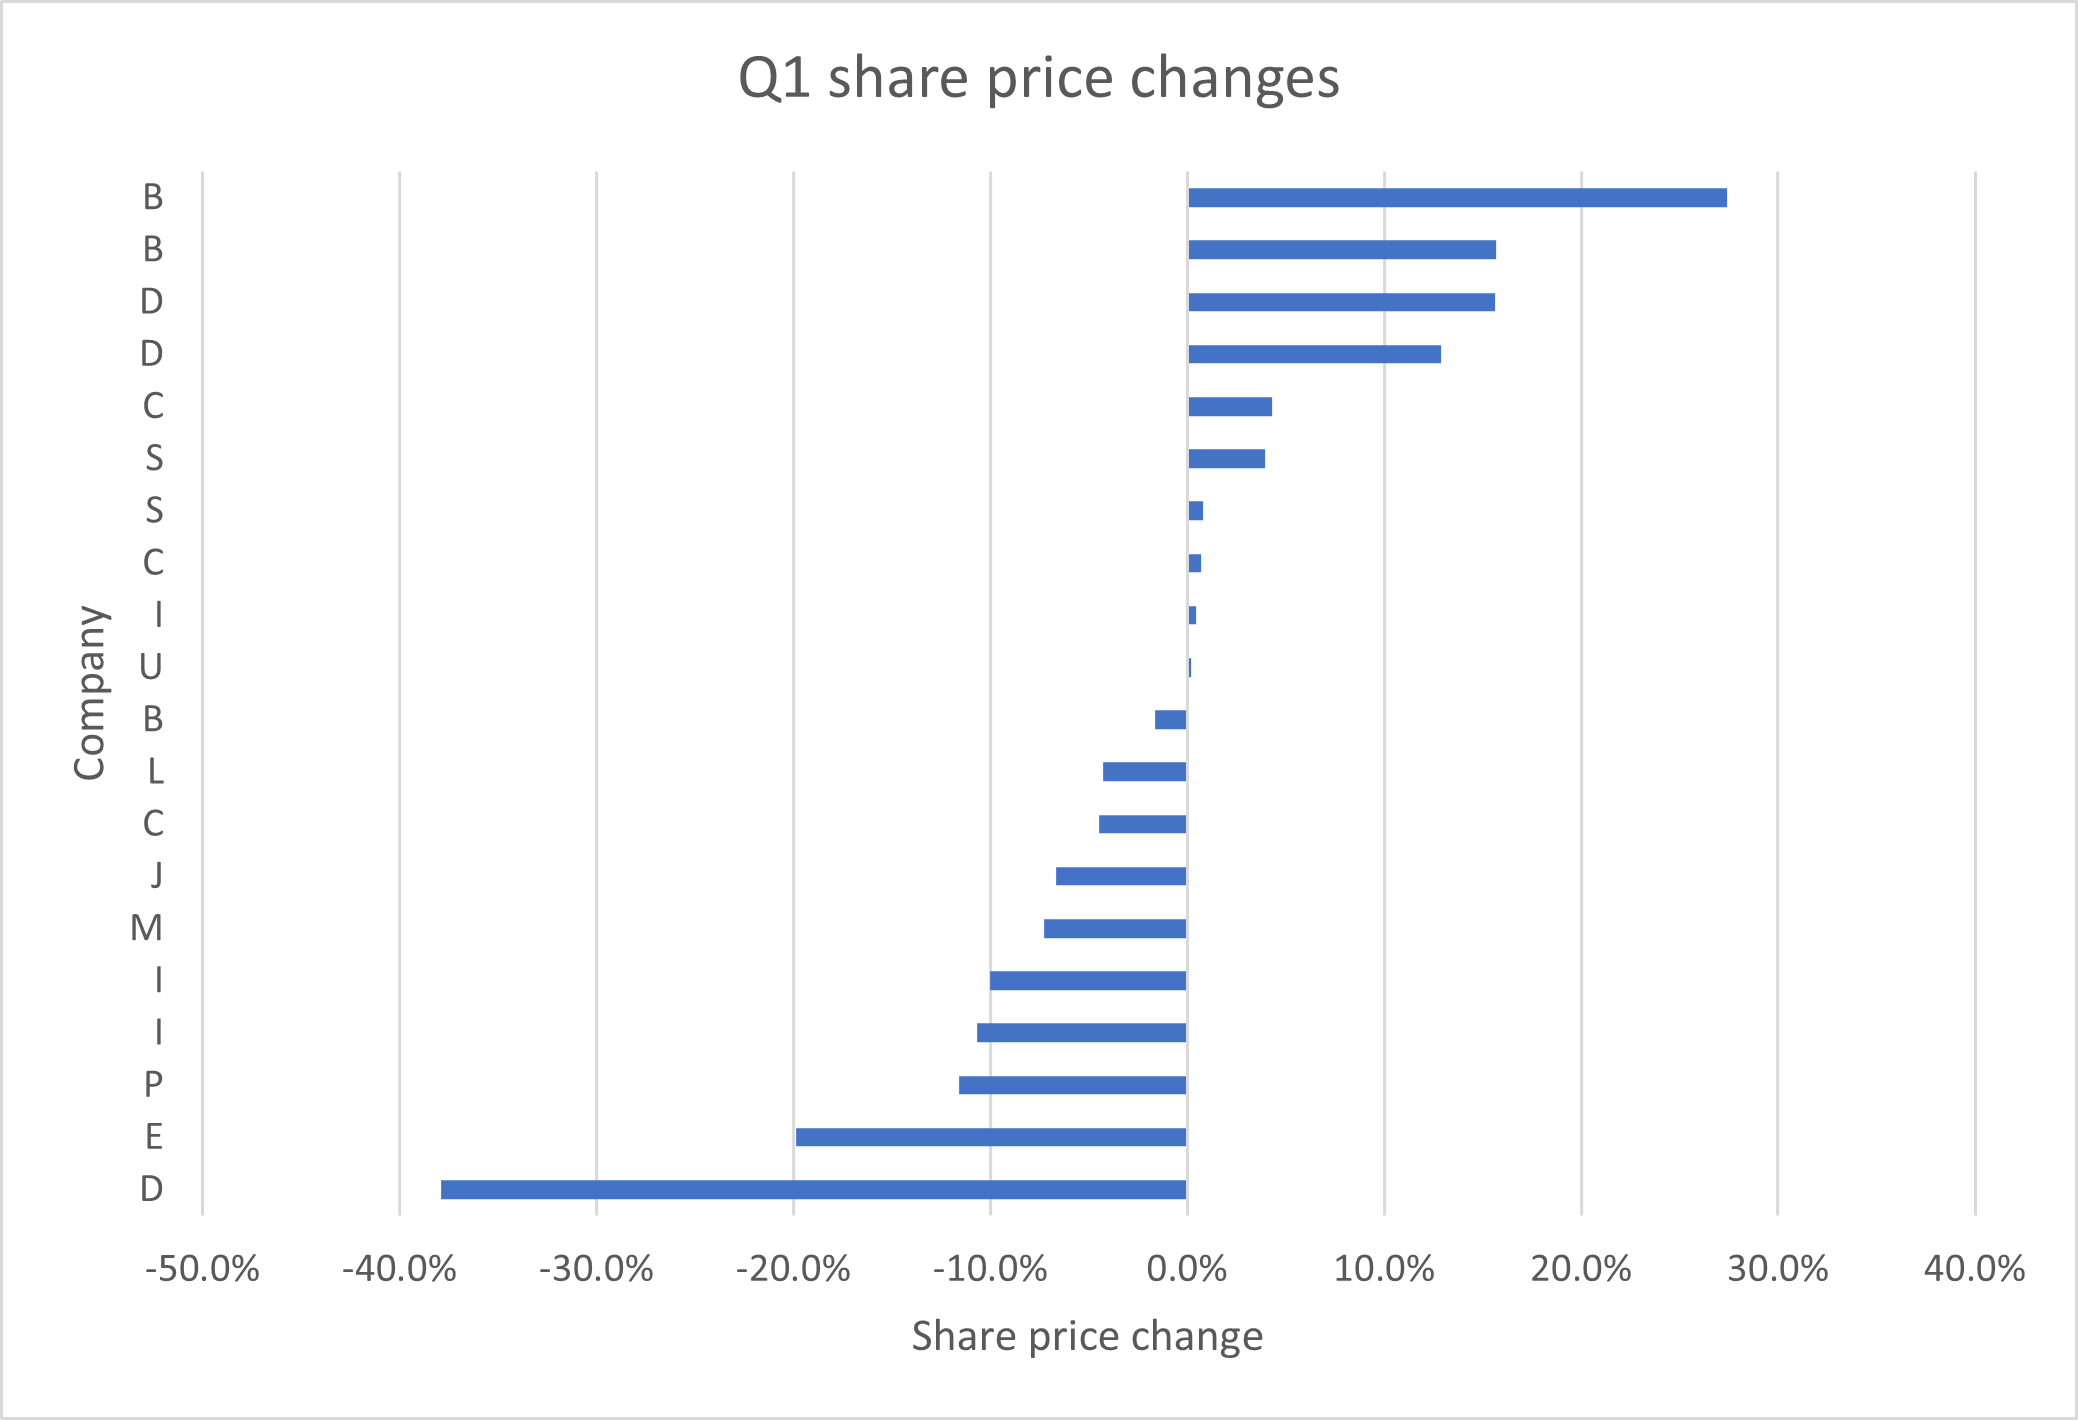
As always, however, portfolio movements usually mask a much wider range of individual share price movements. This chart shows how the stocks in the model portfolio rose and fell during Q1 2023:
Subscribers can see full details of all portfolio shares here.
One quarter is too short a period to draw any conclusions. My hope remains that over time, the above-average profitability and cash generation of the companies in my portfolio will result in attractive long-term gains.
I reviewed results from the majority of companies in the portfolio during February and March. While there are some headwinds and uncertainties ahead, I'm broadly happy with the performance and outlook for these remaining businesses.
In the remainder of this review, I'll explain the changes I made to the portfolio during the second quarter and take a look at the portfolio's key quality metrics.
Stocks sold during Q1 2023
One stock was sold from the portfolio during the first quarter:
- Direct Line Insurance (LON:DLG) - I reviewed the company's 2022 results and explained why I decided to sell in "Should I sell my Direct Line Insurance shares?" on 30 March.
New stocks in Q1 2023
I did not add any new stocks to the portfolio during the first quarter of 2023.
The delay of the EMIS takeover due to a CMA phase two investigation means that I still hold these shares, somewhat against expectations. So I don't need to replace this stock just yet.
If the deal fails altogether, as now seems possible, I'll be happy to continue holding EMIS, all else being equal.
However, the sale of Direct Line means that the portfolio is now reduced to 19 shares. I plan to add a new stock during the next quarter to return to the portfolio to my target size of 20 stocks.
I will publish a detailed review of the new stock on the website ahead of my purchase.
Quality dividend model portfolio: financial metrics
The performance of individual stocks is fascinating and can be very satisfying. But the perfect stock doesn't exist and all investments will have strengths and weaknesses.
Ultimately, the only thing that really matters in investment terms is the performance of the portfolio.
For this reason, one of the techniques I use to monitor the quality and expected performance of my investments is to calculate average financial metrics for the portfolio as a whole.
This allows me to get a feel for the overall shape of the portfolio, and monitor whether it's likely to be improving or worsening.
Here's how my quality dividend model portfolio looked at the end of March 2023 (the Dec 2022 figures are here):
| Median mkt cap | TTM ROCE | TTM EBIT yield | TTM FCF yield | Net debt/5yr avg net profit | TTM div yield | 5yr avg div grth | F'cast div yield | No. yrs div paid |
| £2.0bn | 22.9% | 9.8% | 7.6% | 0.0x | 4.5% | 6.3% | 4.5% | 22 |
Data source: SharePad/author analysis 05/04/2023. Some adjustments were needed - don't take this as gospel.
Let's start with the not-so-good news. The portfolio's trailing 12-month dividend yield of 4.5% is the same as its forecast yield of 4.5%. All else being equal, this implies that the total dividend income from the portfolio won't rise this year.
In practice, this reflects the loss of the Direct Line dividend (which hasn't yet been replaced) and – to a lesser extent – the temporary suspension of another dividend in the portfolio.
I will replace Direct Line in due course, possibly with another high yielder from the financial sector. My hope is that this will return the portfolio to a position where it should provide annual dividend growth.
Reassuringly, the five-year average dividend growth of the stocks remaining in the portfolio looks attractive to me, at 6.3%. Over the medium term, I'd expect this to be sufficient to stay ahead of inflation.
Dividend growth aside, I think the portfolio metrics continue to show most of the qualities I'm hoping to see.
Average return on capital employed of 22.9% is well above the market average. Hopefully this means that my companies have the potential to deliver compound gains over time.
The portfolio's trailing EBIT yield and free cash flow yield reflect attractive valuations, in my view. The free cash flow yield of 7.6% is also comfortably above the average dividend yield of 4.5%. This indicates that in aggregate, my companies' dividends are covered by their surplus cash generation.
Finally, across the portfolio, the average level of gearing is ... zero.
Of course, I should point out that attractive averages can mask many unattractive individual metrics. These figures do not necessarily mean that all the companies in my portfolio are good businesses or sensibly valued.
There's always some risk, but on balance I'm happy with the shape of the portfolio at the moment.
Please let me know whether you think this portfolio average technique is useful in the comments – or share any other thoughts you have about my efforts.
As always, thank you for reading and supporting this project.
Disclosure: at the time of publication, Roland owned shares in EMIS.
Disclaimer: This is a personal blog and I am not a financial adviser. The information provided is for information and interest. Nothing I say should be construed as investing advice or recommendations. The investing approach I discuss relates to the system I use to manage my personal portfolio. It is not intended to be suitable for anyone else.
You should carry out your own research and make your own investing decisions. Investors who are not able to do this should seek qualified financial advice. Reasonable efforts are made to ensure that information provided is correct at the time of publication, but no guarantee is implied or provided. Information can change at any time and past articles are not updated.