
H1 2023: positioning the portfolio for long-term growth
Falling share prices during the first half of the year left my portfolio lagging behind the FTSE 100. I think there's value on offer and have been buying more shares.


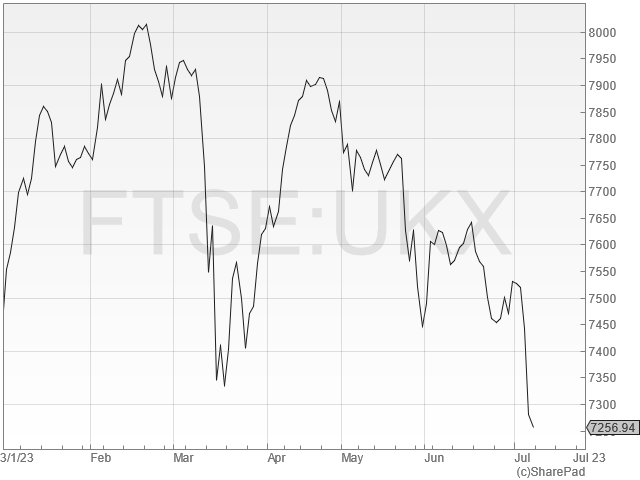
The year started with a period of stock market exuberance that looked unwise to me. My feeling was that investors were underestimating the impact of higher-for-longer interest rates and inflation.
The second quarter has seen a more subdued performance, with the FTSE 100 giving up its early gains and ending the half year unchanged.
My model dividend portfolio (and my real-money holdings) have also suffered. The model portfolio has lagged behind the FTSE 100 so far this year.
In my defence, the FTSE 100's market-cap weighted construction means that its performance is disproportionately influenced by a handful of oil and banking giants. I think six months is too short a period to draw any useful conclusions.
I remain comfortable with the performance of the underlying businesses in my portfolio. I'm also pleased to have been able to add a new holding at what I believe is a very attractive valuation.
In addition, I've used some of the model portfolio's accumulated dividend cash to top up selected existing holdings.
Over the coming quarter, I am considering one further possible change in keeping with my slow trading policy, but I haven't yet finalised this decision.
As always, subscribers will receive an in-depth review of any new shares before I add them to the model portfolio, or buy them myself.
New podcast: IntegraFin impressed me
Before I look at the performance of my portfolio in more depth, I just want to let you know about a new podcast I recorded recently with my friend and fellow investor Maynard Paton.
This time, we looked at FTSE 250-listed investment platform IntegraFin (LON:IHP) – and I have to admit I was impressed.
This business is similar to AJ Bell and Hargreaves Lansdown. However, IntegraFin only serves financial advisers, who use the platform to manage their clients' cash.
I think IntegraFin looks like a quality business. It's certainly a stock I might consider owning.

H1 2023 portfolio performance
To recap, the portfolio I'm discussing here is my quality dividend model portfolio, which is run using my dividend screening system.
The model portfolio was launched on 1 December 2021. It contains largely the same shares as my personal portfolio, which has been run on a similar basis for a number of years.
Here are the performance figures for the first six months of 2023.
H1 2023:
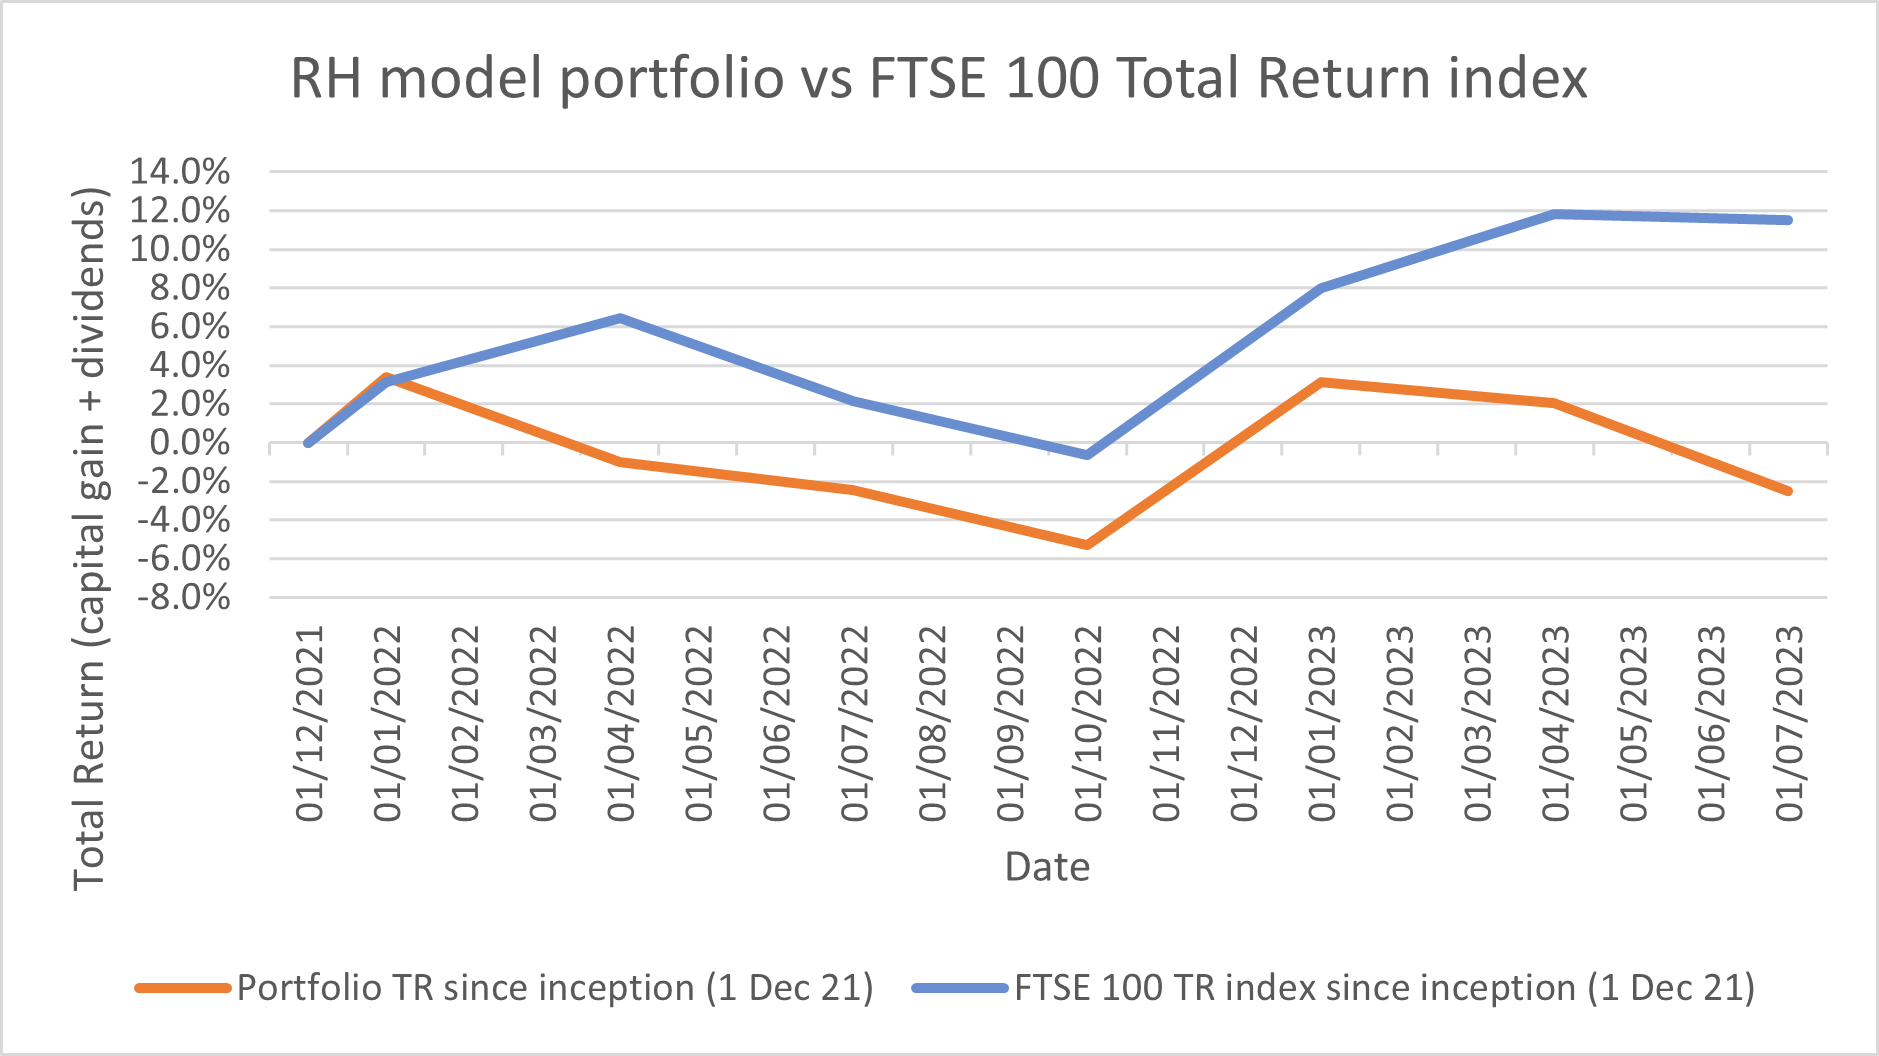
- Model portfolio total return: -5.4% (including 2.2% dividend income)
- FTSE 100 total return: 3.1% (including 2.2% dividend income)
This chart shows the portfolio's performance against the FTSE 100 Total Return index* since the model portfolio's inception on 1 December 2021. Both lines show total return (capital return + dividends):
Of course, portfolio movements generally mask a much wider range of individual share price movements. Here's how the individual stocks in the model portfolio rose and fell during the first half of 2023:
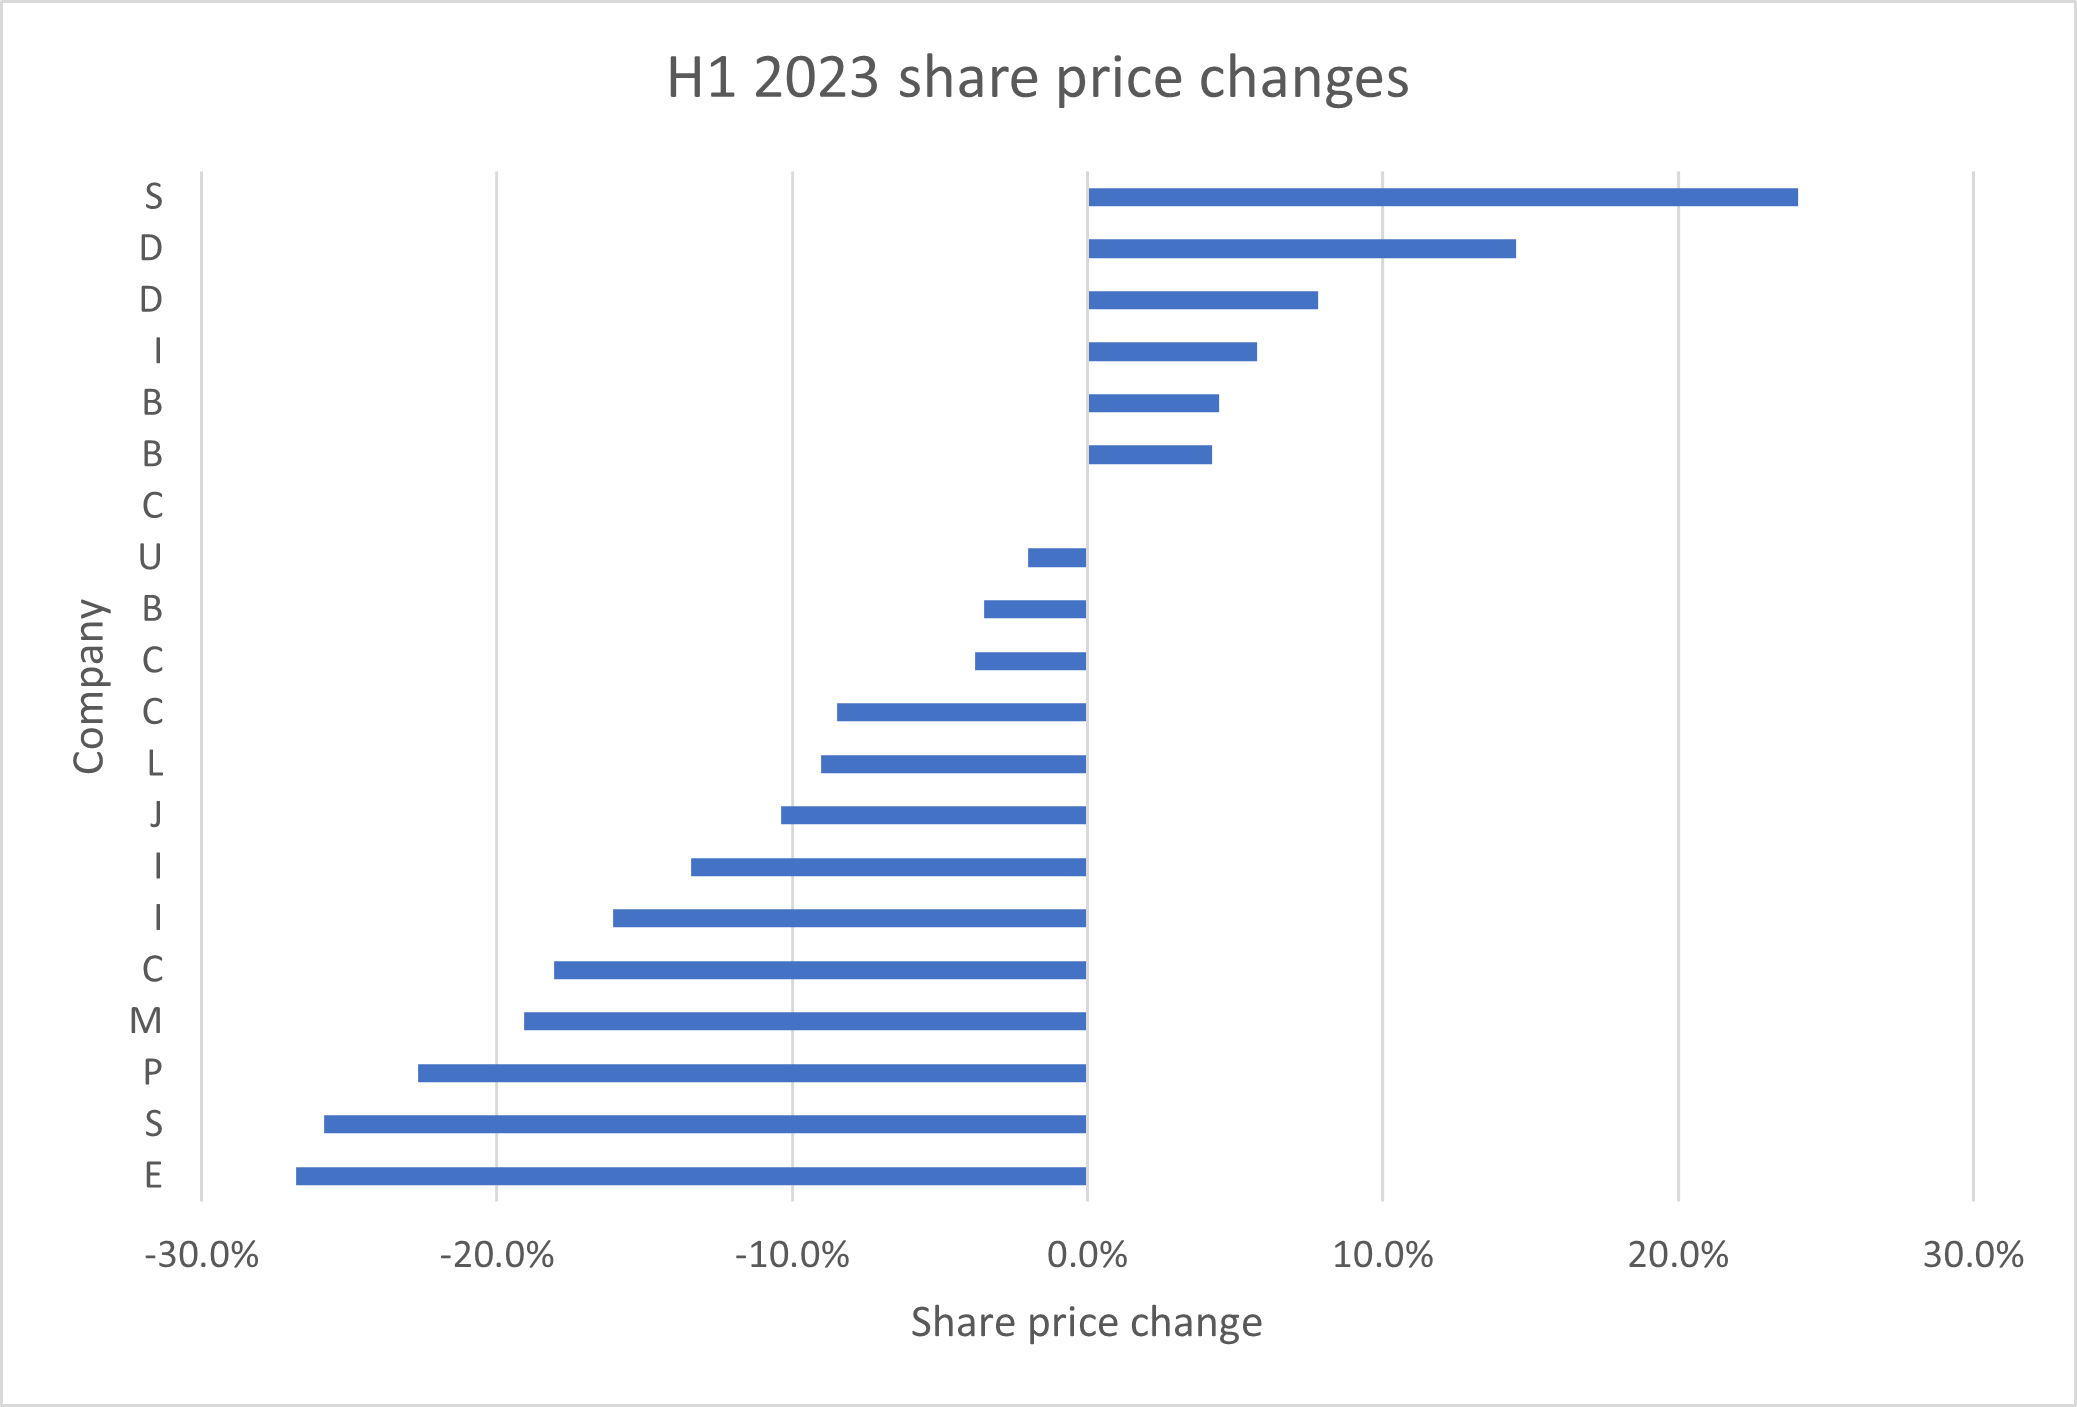
On average, the share price of portfolio stocks fell by around 6% during this period.
Falling share prices are never pleasant. But they don't concern me too much if the underlying business is performing acceptably and is continuing to support a stable or increasing dividend.
My reviews of company results from the first half of the year have not flagged up any serious issues and have been broadly reassuring.
There are only really two areas of concern that have emerged, in my view:
- a small-cap stock covered in my June portfolio review is not evolving in the way I expected. I still think it's a decent business, but I'm not longer sure it's the right type of company for my dividend portfolio. This position is now under review.
- a well-established FTSE 250 share is being buffetted by external events and is not as profitable as I'd like. However, I think the business is being well run and is moving in the right direction. As I explained in June, I'm inclined to remain patient.
It may just be a coincidence, but these two stocks are also currently the lowest-scoring shares in my dividend screen results. I hope this may help to validate my use of the screen to help me select stocks.
Stocks sold during H1 2023
I sold one stock from the model portfolio during the first half of the year, making the same sale from my personal holdings:
- Direct Line Insurance (LON:DLG) - I reviewed the company's 2022 results and explained why I decided to sell in "Should I sell my Direct Line Insurance shares?" on 30 March.
New stocks & top-ups during H1 2023
In keeping with my slow trading policy, I've now selected and added a new stock to the portfolio to replace Direct Line. The new share was added on 30 June 2023.
- Subscribers have already received an in-depth review of the company I chose, "A high-yield stock to replace Direct Line"
Dividend reinvestment: no cash is withdrawn from the model portfolio. This means that after 19 months, accumulated dividend income had left the portfolio with a cash weighting of nearly 15%.
This was well above my target level of 5%, so I've recently used some of this virtual cash to top up some existing holdings. Subscribers will receive a full report on these top ups later in July, but full details are already available on the portfolio page.
Model dividend portfolio: financial metrics
I can't deny the satisfaction I get when an individual share I own soars in value. But in reality, such isolated achievements do not reveal much about the success of a portfolio or an investment strategy.
Ultimately, portfolio performance is the only metric that matters, in my view. For this reason, one of the techniques I use to monitor the quality and potential performance of my investments is to calculate average financial metrics for the portfolio as a whole.
This allows me to get a feel for the overall shape of the portfolio, and monitor whether it's likely to be improving or worsening.
Here's how my quality dividend model portfolio looked at the end of June 2023 (the March 2023 figures are here):
| Median mkt cap | TTM ROCE | TTM EBIT yield | TTM FCF yield | Net debt/5yr avg net profit | 5yr avg div grth | TTM div yield | F'cast div yield | No. yrs div paid |
| £1.7bn | 21.6% | 11.1% | 7.7% | 0.1x | 4.8% | 4.9% | 5.0% | 22 |
Data source: SharePad/author analysis 08/07/2023. Some adjustments were needed; don't take this as gospel.
The average dividend screen score of the portfolio stocks at the end of June 2023 was 67/100.
Most of these figures are broadly unchanged from the first quarter, but I think there are a few differences worth highlighting.
The median market cap of the portfolio has fallen from £2bn to £1.7bn. There are two reasons for this – falling share prices and the replacement of Direct Line with a smaller company.
The portfolio's average ROCE has fallen slightly, from 22.9% to 21.6%, but I think it's more significant to note that EBIT yield has risen from 9.8% to 11.1%. This is a valuation measure and reflects the fact that falling share prices have not (yet) been fully reflected in falling profits. In other words, the portfolio looks cheaper, on this measure, than it did three months ago.
The portfolio's free cash flow yield of 7.7% is almost unchanged. This implies that the trailing dividend yield of 4.9% is covered by surplus cash generation, in aggregate.
Overall leverage (net debt/5yr avg profit) across the companies in the portfolio remains almost zero, reflecting a mix of net cash and net debt positions.
Meanwhile, the portfolio's forecast dividend yield has improved from 4.5% to 5.0%, reflecting the addition of a high-yielding stock to replace Direct Line.
If the five-year average dividend growth rate of 4.8% can be maintained, then this suggests a possible total return of almost 10% per year, on a medium-term view.
Reassuringly, the average dividend record of the companies in the portfolio is unchanged, at 22 years.
Of course, these attractive averages may mask some unattractive individual metrics. They do not mean that all of the companies in the portfolio are good businesses or that they are attractively valued.
To address this risk, I review each company's results in detail at least twice a year and monitor all newsflow from the shares I own. These reviews are all available in my newsletter archive.
For now, I remain happy with the portfolio and am not planning any changes to my stock selection strategy, or to the system I use for managing the portfolio.
As always, thank you for reading and supporting this project. Please feel free to get in touch with any questions or feedback – you can reach me by email or on Twitter.
All the best,
Roland
*Benchmark change: I previously used the iShares Core FTSE 100 UCITS ETF GBP (Acc) (LON: CUKX) as a benchmark. CUKX is effectively the FTSE 100 TR index in an ETF, so the change is merely a simplification and does not affect the performance record of my portfolio against its benchmark.
Disclaimer: This is a personal blog/newsletter and I am not a financial adviser. All content is provided for information and educational purposes only. Nothing I say should be interpreted as investing advice or recommendations.
You should carry out your own research and make your own investing decisions. Investors who are not able to do this should seek qualified financial advice. Reasonable efforts are made to ensure that information provided is correct at the time of publication, but no guarantee is implied or provided. Information can change at any time and past articles are not updated.